Short-term trader's survival kit: A no-nonsense guide
Price action is survival in short-term trading. Real Bitcoin case studies show $95K breakout to $126K and $94K fakeout with risk management.

By Mohak Khemka · Former Prop Trader & Dealer | Technical Analysis Evangelist
13 February 2026 · 9 min read

A no-nonsense guide to price action and technical analysis
In the world of short-term trading, time is a luxury you don’t have. While fundamental analysis - studying earnings, GDP, and supply chains - is crucial for long-term investors, it is often too slow for the trader looking to capture a quick move in the markets.
Over the last 8 years of trading derivatives, I’ve navigated through bull runs, crashes, and sideways chops. If there is one lesson the markets have hammered into me, it is this: when leverage is involved, Price Action isn't just a tool; it is your survival kit.
The philosophy: "The market discounts everything"
Technical Analysis (TA) is built on a simple yet controversial assumption: The price on your screen already reflects all available information.
Whether it’s insider information, a spike in volume, or an aggressive breakout, the market "knows" before the news hits the headlines. A sudden directional move often signals that "someone knows something." As traders, we don't need to know what they know; we just need to be on the right side of the move.
By reading the chart, you can take an educated guess and position yourself to profit - or at least avoid getting caught on the wrong side.
Rule #1: Don’t clutter your charts
TA is a vast field with thousands of indicators. The biggest mistake I see new traders make is "Analysis Paralysis" - loading a chart with 10 different oscillators until the price candles are barely visible.
If you have to squint to see the price, you are doing it wrong. Over nearly a decade of trading across global exchanges, I’ve learned that simple is scalable. You don't need every tool; you just need the ones that work for you.
The timeframe dilemma: The top-down approach
A common question I get is: "Which timeframe should I watch?"
The answer is never just one. To trade effectively, I use a three-step Top-Down Approach:
- The daily chart (The roadmap): This shows the long-term trend. As seen in our Bitcoin examples below, big moves (like the break to $126k) happen on the Daily chart. I check this to see if the overall market is Bullish or Bearish.
- The 60-minute chart (The compass): This shows the medium-term trend. I use this to confirm that momentum aligns with the Daily view.
- The 15-minute chart (The trigger): This is the execution zone. Once the Daily and 60-minute charts align, I drop to the 15-minute chart to find my precise entry.
The golden rule:
The shorter the timeframe, the less reliable the analysis becomes.
Charts like the 1-minute are full of "noise" - random price spikes caused by algorithms that don't represent true sentiment. Stick to the 15-minute and above to filter out the noise.
The toolkit: Trade what you see, not what you think
My approach relies on pure Price Action coupled with specific, non-lagging tools. Here is the breakdown:
1. Candlesticks: The language of war
Candlesticks narrate the war between Buyers (Bulls) and Sellers (Bears).
The rejection (Pin bar): A long "wick" sticking out of a level tells you that one side tried to push the price, but the other side slapped them back.
The power move (Engulfing): A massive candle that completely "eats" the previous one signals a strong shift in momentum.
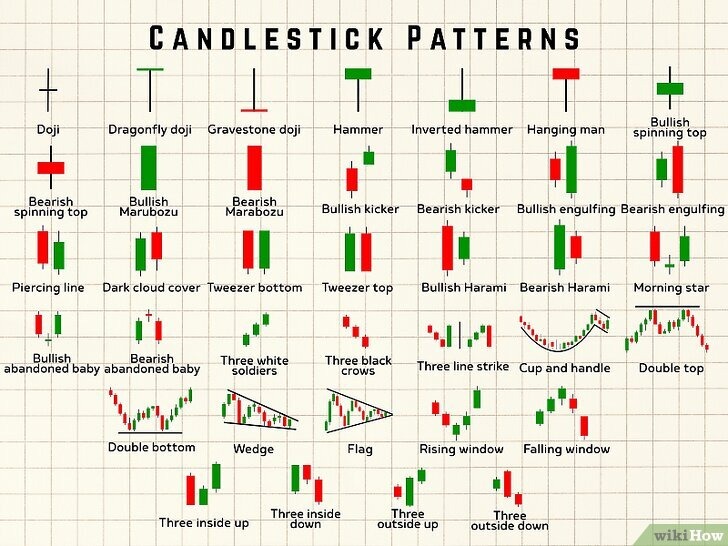
Source: wikiHow
2. Structure: Support, resistance, and patterns
Before you look at any indicator, draw your lines. Horizontal Support and Resistance levels are where the "memory" of the market lives. Combine these with classic patterns like Double Tops/Bottoms or Head and Shoulders.
3. The trend compass: 21-day EMA
I use one dynamic tool: the 21-day Exponential Moving Average (EMA).
- The Use Case: It acts as a dynamic support/resistance line. If the price is above the 21 EMA on your Daily or 60-minute chart, the bias is typically Bullish.
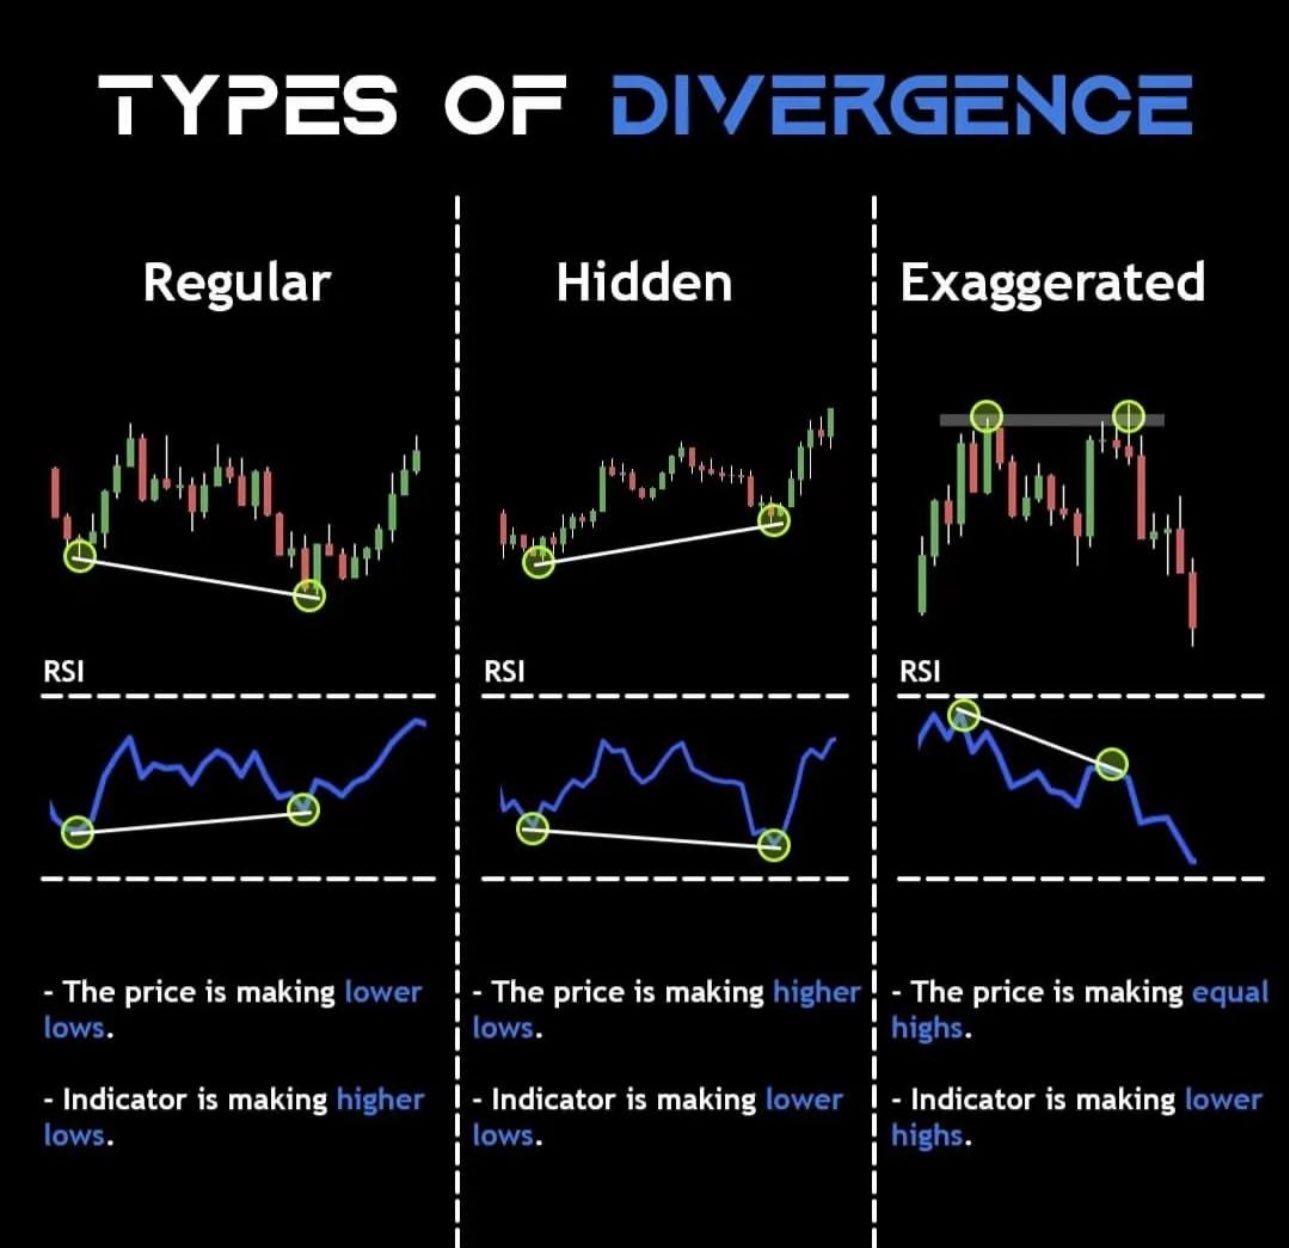
4. The "Forward-Looking" edge: RSI divergence
Most traders use the RSI incorrectly by selling just because it hits 70 (Overbought). In a strong trend, the market can stay "Overbought" for days.
The fix: Look for Divergence. If price is moving higher but RSI is moving lower, it gives you a "hint" that the rally is weak and a reversal is imminent.
Real-world analysis: Putting theory into practice expert trading insights
Theory is useless without application. To understand how these concepts work in the wild, let's look at two real setups on Bitcoin (BTC/USD). One shows a perfect breakout, and the other teaches us the most important lesson in trading: how to handle a failure.
Note: The following examples are for educational purposes only. Past performance does not guarantee future results.
Case study 1: The "Blue Sky" breakout (April 2025)
- Context: Bullish Trend Continuation & All-Time Highs
In April 2025, Bitcoin was hovering around the $95,000 mark. The market had been consolidating for two months, creating a zone of "seller exhaustion."
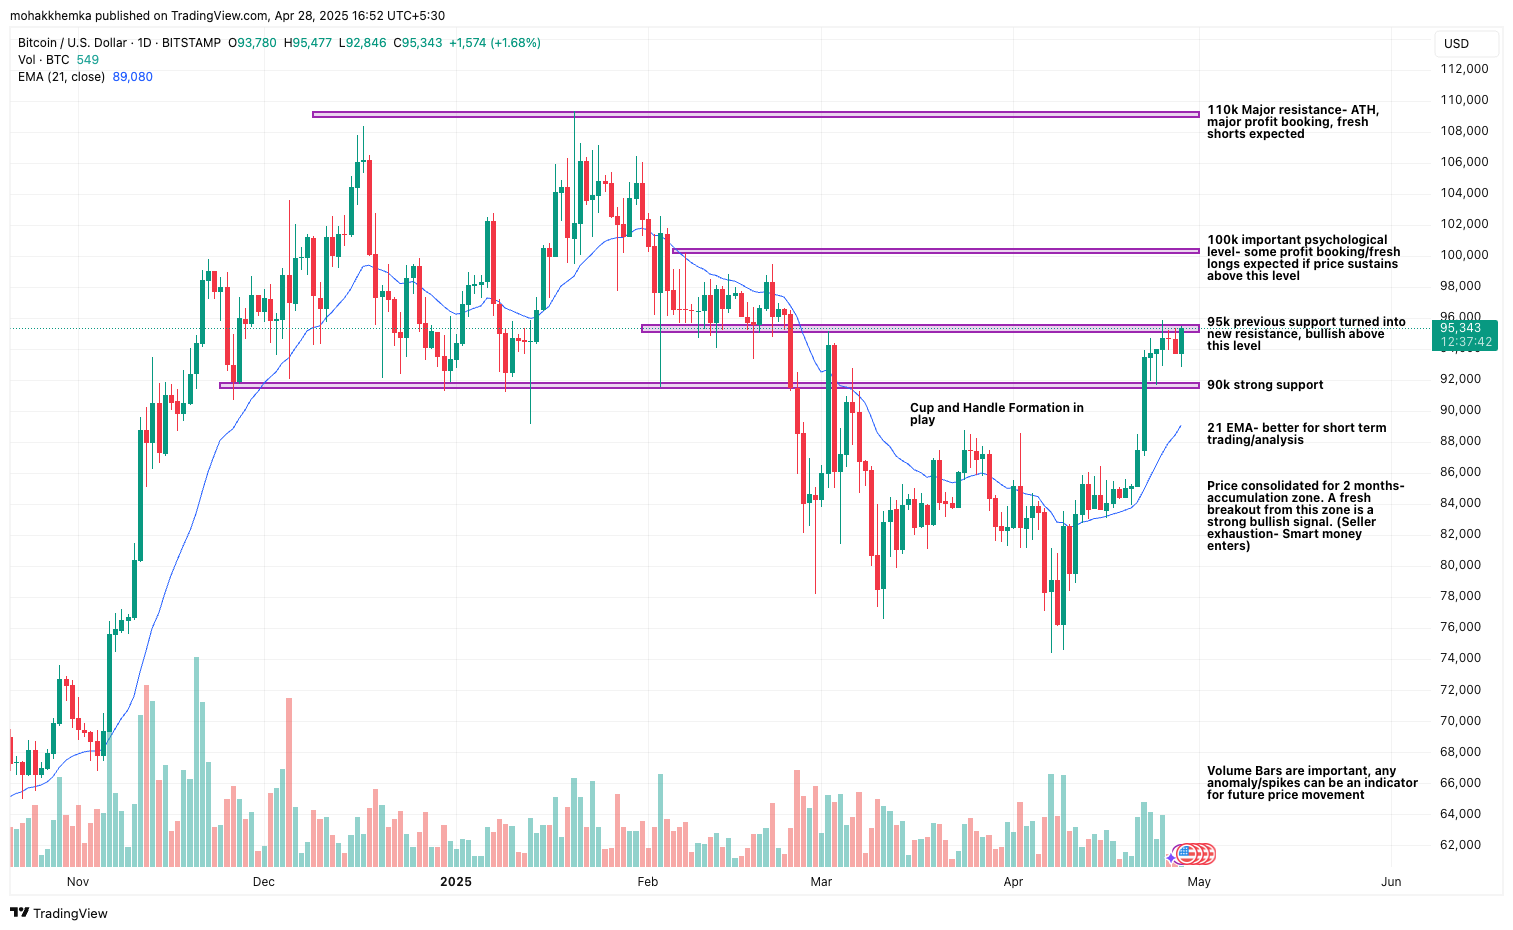
Source: TradingView
The technical setup:
- Pattern Recognition: The Daily chart formed a classic "Cup and Handle" formation - a reliable bullish continuation pattern.
- The Trigger: The critical signal was the daily close above $95,000, a previous support flipped to resistance.
- The Trend Filter: Notice the blue line? That is the 21 EMA. Price was respecting this line as dynamic support, confirming the trend was healthy.
- The Result: Following this breakout, Bitcoin rallied past our initial targets to set a new All-Time High of $126,000 before retracing.
The masterclass: How to exit a trade at all-time highs
The hardest part of this trade wasn't the entry; it was the exit. When an asset enters "uncharted territory" (new ATHs), there is no resistance left to guide you. In this scenario, we use two strategies:
- The Banker (Conservative): Book profits at the next psychological resistance ($110k). This secures the bag but risks missing the "moon" move.
- The Trailer (Aggressive): To catch the move to $126k, you use a Trailing Stop Loss. As long as price makes Higher Highs, stay in. Exit only when a key consolidation level is broken or price makes a Lower Low.
Case study 2: The "Fakeout" (Feb 2026)
- Context: Failed Trend Reversal
- The Lesson: Not all technical signals work. Risk Management is the only safety net.
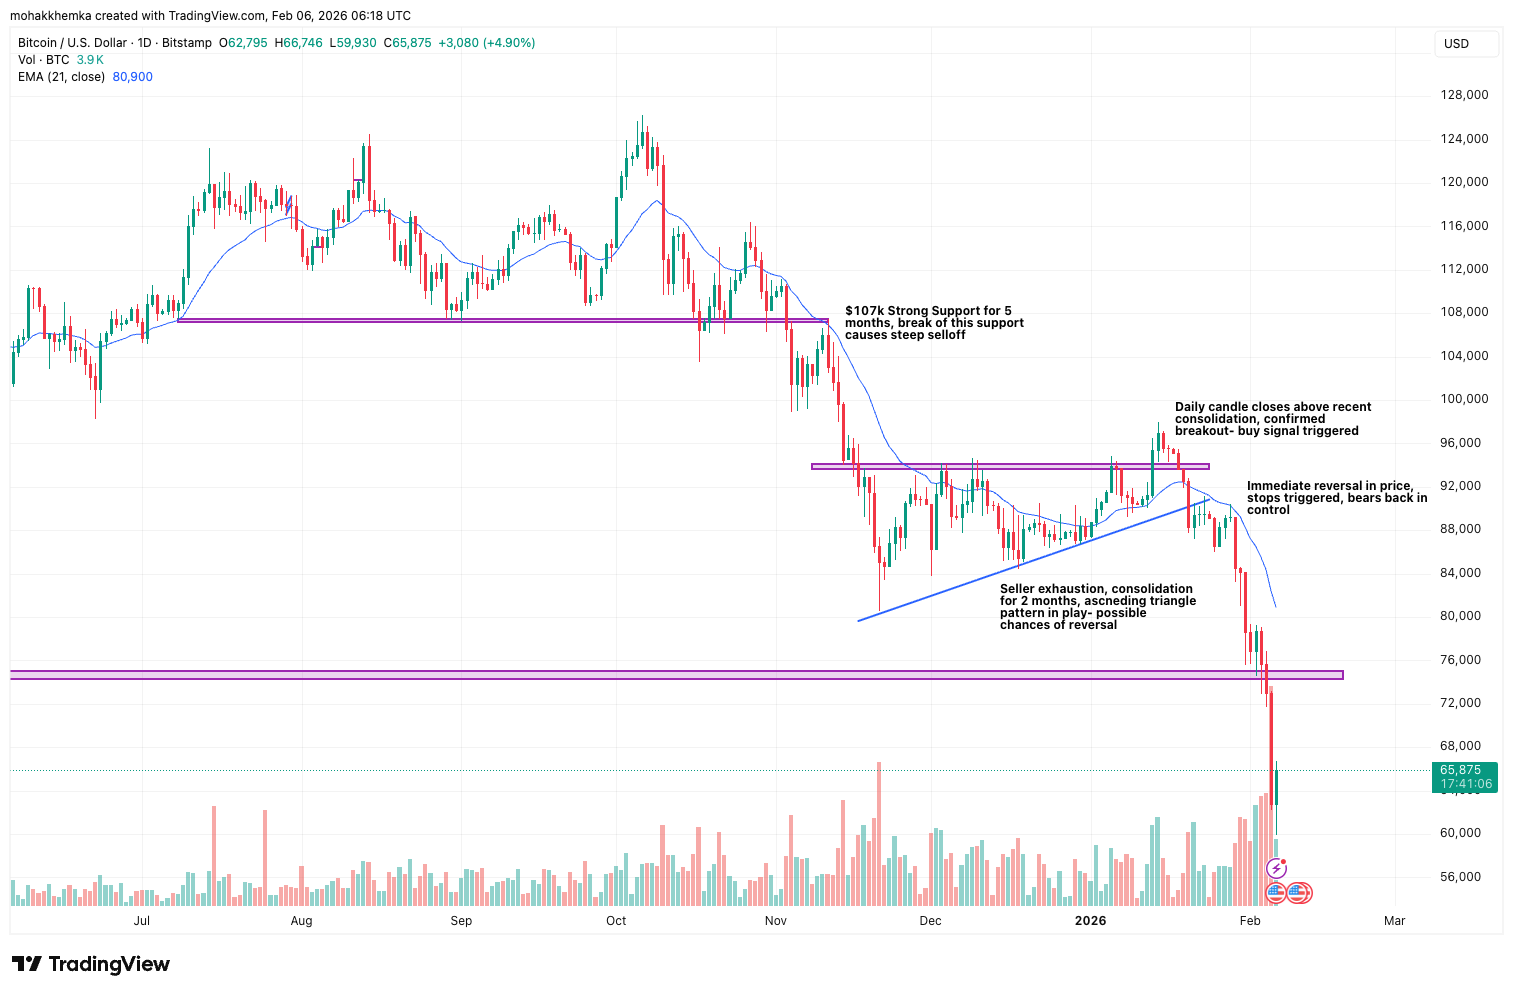
The setup (The bullish signal):
A common mistake traders make is "Catching a Falling Knife" - buying an asset simply because it has dropped significantly. A safer approach is waiting for market structure to shift.
- Consolidation: After a steep correction, BTC/USD formed an Ascending Triangle, consolidating for two months.
- The Trigger: The chart printed a Daily Candle close comfortably above the $94,000 resistance level. From a technical perspective, this break implies that bulls have regained control.
- The Potential: With the breakout confirmed, the technical target was $107k (previous support turned resistance). The setup appeared valid.
The failure (The market reality):
Markets are dynamic. Immediately after triggering the technical buy signal, the trend reversed. The market saw a sharp selloff, invalidating the breakout pattern within days.
The exit strategy (The safety net):
This scenario highlights where the amateur holds and hopes, while the professional executes the plan.
- Conservative stop: The invalidation point was the close back below the breakout level ($94k). An exit here minimises the loss immediately.
- Aggressive stop: The absolute line in the sand was the trendline support ($90k).
By adhering to these levels, a trader would accept a small, calculated loss. Holding the position in hopes of a rebound would have exposed the account to the massive crash that followed. The "win" here was not profit, but capital preservation.
The "Holy Grail": Risk management risk management strategies
If there is a secret to trading, this is it. Risk management ensures you have enough ammunition to come back and fire again tomorrow. Markets will exist for centuries; your goal is to ensure you do too.
1. The stop loss (Be a mental athlete)
Have a fixed stop in the system, not in your mind.
- Don't Marry Your Positions: My mentor used to say this, and it stuck with me. Don't hope for the price to reverse; it usually won't.
- Pull the Plug: A small loss is painful, but it’s far better than the stress of a blown account. A stop loss buys you a peaceful night's sleep.
2. The 2:1 risk-reward ratio
Ideally, target a 2:1 ratio (risk $1 to make $2). With this ratio, you can be wrong 50% of the time and still make money. If you lose 50% of your capital, you need a 100% gain just to break even - so protect your downside fiercely.
3. Avoid revenge trading
This is the worst mental state to be in. Never take a trade just because you are angry about a loss. If you try to win your money back instantly, you are gambling, not trading.
4. Patience: The lion’s mindset
Adopt the mindset of a lion. A lion doesn't hunt every animal it sees; it waits for the perfect opportunity. Don't trade because you are bored. Wait for your setup.
Conclusion
When it comes to Technical Analysis, less is more.
Stick to the basics (Price Action + Structure), trust the process, and follow your plan. This combination allows you to trade any asset on Earth - whether it’s Gold, Oil, or a Volatility Index - without even knowing its name.
Happy trading!