The Kelly Criterion: A retail trader’s guide to position sizing
Two traders with the exact same signals can end up with wildly different accounts. Learn how to use the Kelly Criterion to size your trades and avoid blowing up.

By Prashant Sinha · Multi-asset Trading Strategist & Market Risk Specialist
30 April 2026 · 3 min read

Risk warning: Trading involves substantial risk and you can lose money. This article is for educational purposes only trading guides and does not constitute financial or investment advice. It does not recommend specific trades or position sizes. Consult a licensed financial advisor expert traders for personalised guidance.
Most traders spend 95% of their energy on the wrong question.
They obsess over what to trade — the chart pattern, the breakout, the news catalyst. Then they pick a position size more or less the way they pick a Netflix show: gut feel and how confident they're feeling that morning.
After years of building quant systems, here's the uncomfortable truth: two traders with the exact same signals can end up with wildly different account balances purely because of how much they trade. One compounds steadily. The other blows up.
This post is about the math behind how much — the Kelly Criterion.
The problem Kelly solves
Imagine a coin toss. Heads 60% of the time pays 1:1. Tails, the position is lost. The starting capital is $10,000.

How much do you allocate?
- Allocate too little, and growth may be slow even with a real edge.
- Allocate too much, and one cold streak could wipe out the account, even when the odds may favour the trader.
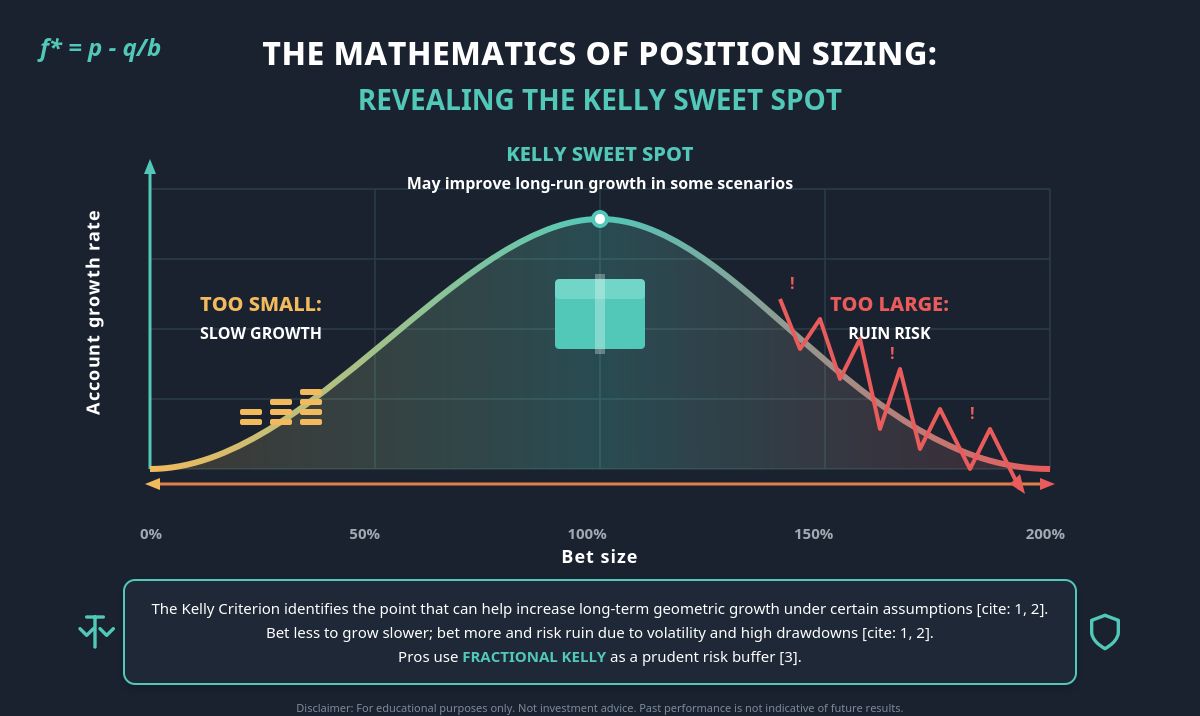
There's a sweet spot that may improve long-run growth in some scenarios. That's what John Kelly Jr. solved at Bell Labs in 1956. Edward Thorp later applied it to blackjack and went on to run one of the more successful hedge funds in history.
The formula (simpler than it looks)
The classic form:
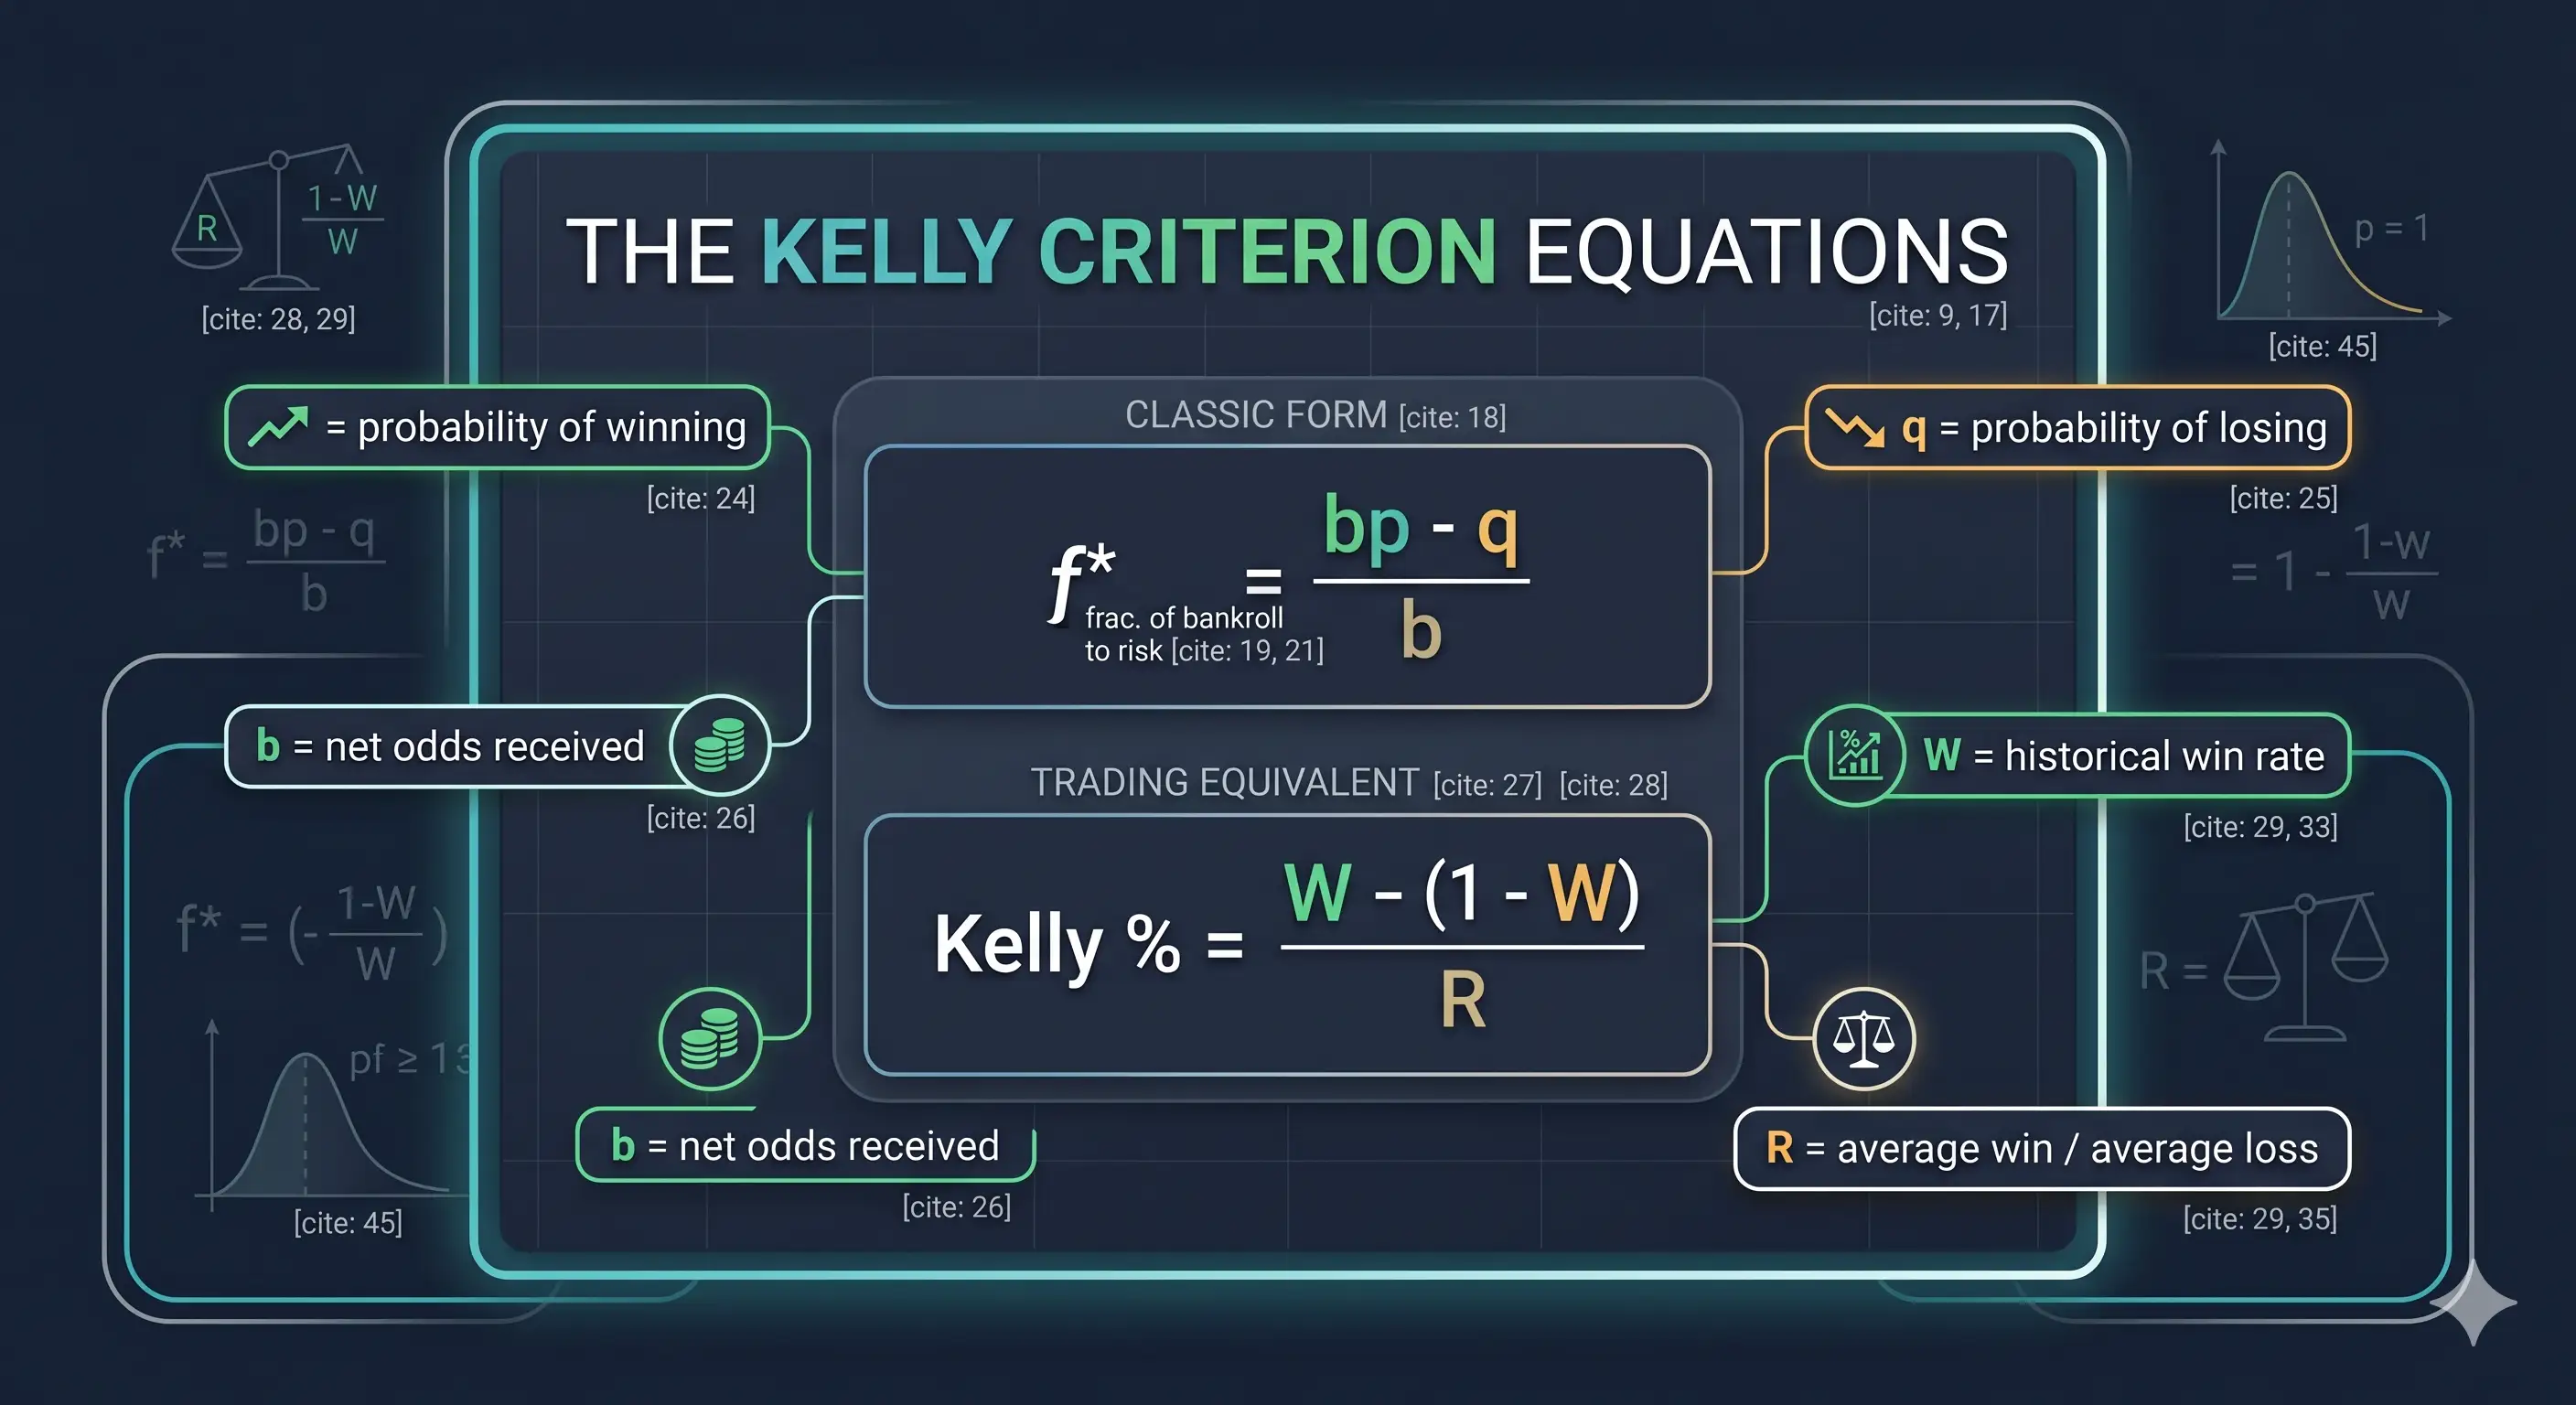
- f* = fraction of bankroll to allocate
- p = probability of a profitable outcome, q = probability of an unprofitable outcome (1 − p)
- b = payoff ratio when the trade is profitable
For trading, most practitioners (Zerodha Varsity, QuantInsti) use the equivalent:
Kelly %=W−1−WR
Where W is your historical profitable-trade rate and R is your average gain divided by your average loss.
In plain English: the formula suggests a larger allocation when the edge is bigger, and a smaller allocation when it shrinks. That's it.
A worked example
Consider a trader who has journaled their last 100 trades — and if they haven't, that's where to start.
- Profitable trade rate (W): 55%
- Average gain: $200, average loss: $100 → R = 2.0
Kelly % = 0.55 − (0.45 / 2.0) = 0.325
The Full Kelly formula, in this theoretical example, yields an allocation of approximately 32.5% of capital. On a $10,000 account, that translates to roughly $3,250 of theoretical exposure per trade. This is an illustrative calculation and not a recommendation.
Right about now, every honest trader should feel slightly nauseous. Good. That's the right reaction.
Why nobody sane uses Full Kelly
Under specific theoretical assumptions, the Full Kelly fraction can be the theoretically optimal choice for maximising geometric growth — but only under conditions that don't exist in real markets:
- The true rate of profitable trades is unknown. Traders work from an estimate, and it may be too optimistic. As Analytics.bet puts it: "If you think your edge is 10%, it's probably more like 5%, or even 2-3%."
- Odds aren't constant. Markets regime-shift. An edge today may be gone next quarter.
- The swings can be hard to stomach. Full Kelly has a brutal property: roughly an X% chance the bankroll drops to X% of where it started (Enlightened Stock Trading).
Worse: allocate twice the Kelly fraction, and the expected long-run growth may be zero — even with a real edge.
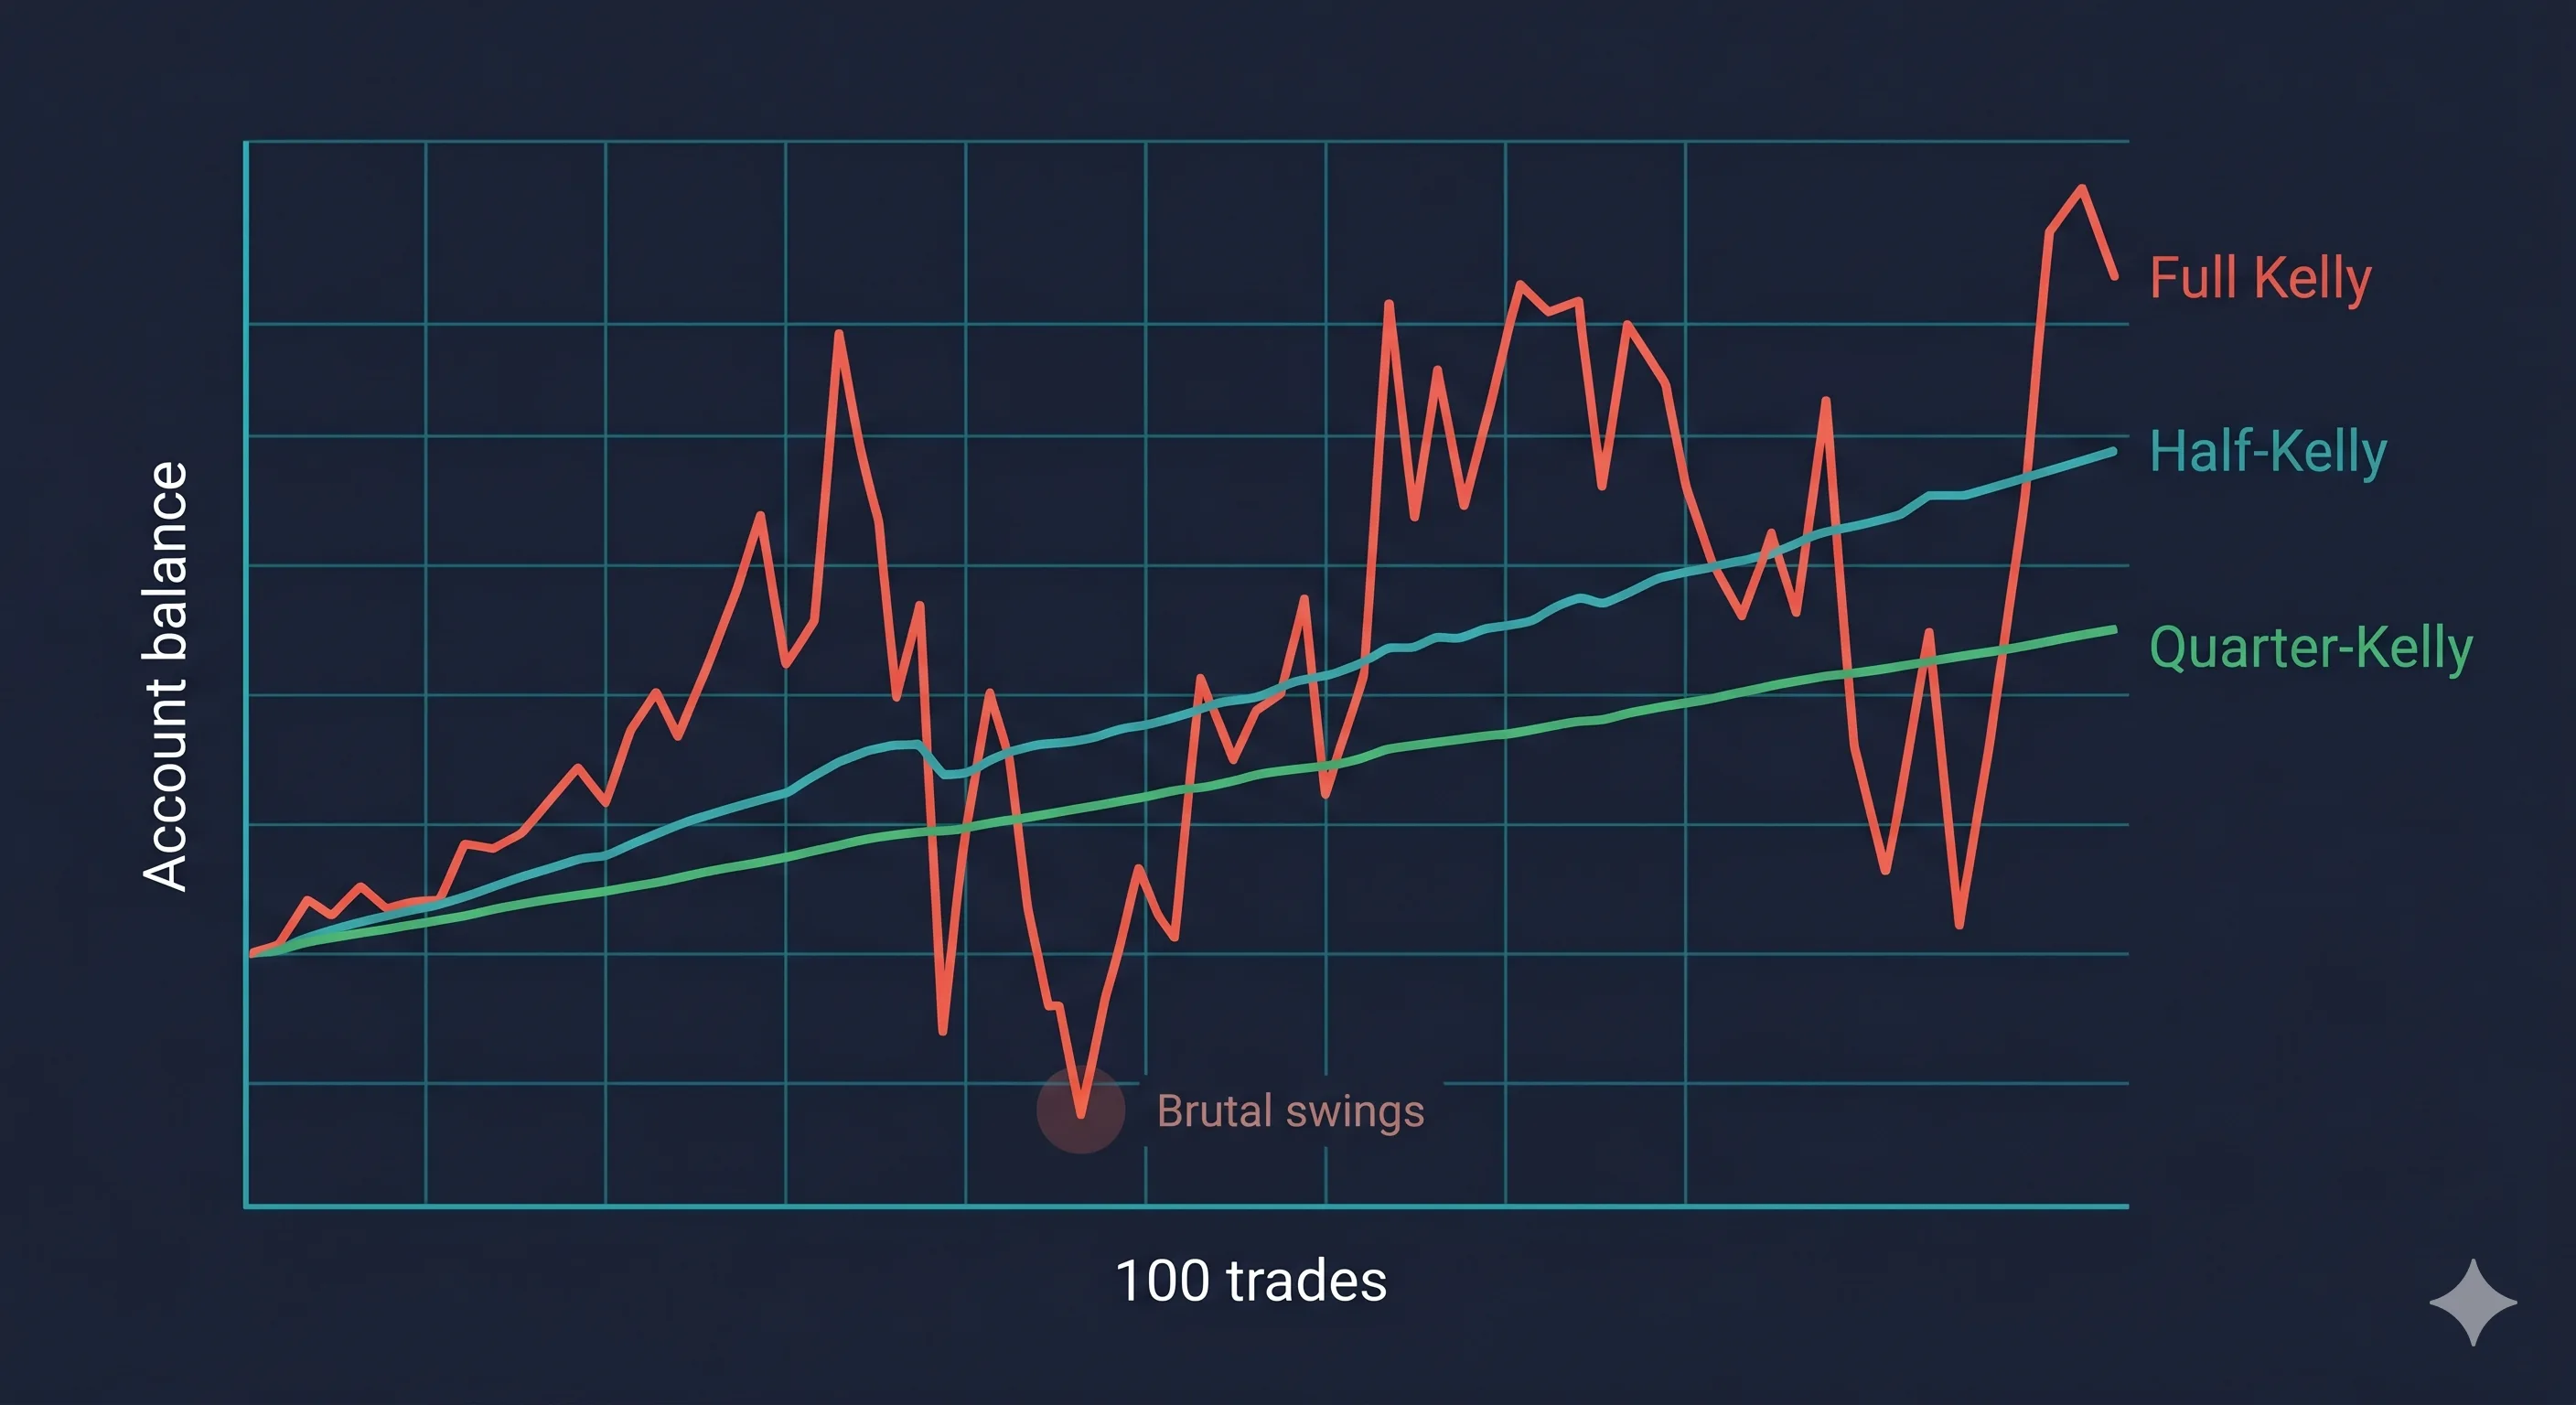
This is why almost every professional uses Fractional Kelly — typically half- or quarter-Kelly. In the example above:
- Half-Kelly: the formula yields approximately 16% in this theoretical example
- Quarter-Kelly: the formula yields approximately 8% in this theoretical example
For most retail traders, even quarter-Kelly may be aggressive. As an illustrative example of risk management, some traders reference caps such as 1–2% of capital and use Kelly to scale within that cap; this is not financial advice and individual circumstances vary.
Pitfalls nobody tells you about
- Garbage in, garbage out. A "60% profitable trade rate" from 20 cherry-picked trades may be fiction.
- Negative Kelly = don't trade. A negative result generally suggests the trade does not have a positive expected edge.
- Correlated positions can break the math. Five "different" longs that are really the same Nasdaq beta exposure may expose the account to 5x what Kelly suggests.
- Fat tails eat optimisers for breakfast. Practitioners commonly pair Kelly with a hard stop-loss to manage tail risk.
- Big "edges" are usually wrong. When a model claims a 30% edge, the likeliest explanation is that the model is broken.
A Monday-morning checklist
- Journal everything. 50–100 trades may be needed before Kelly inputs mean anything.
- Calculate W and R honestly. Every trade counts.
- Compute Full Kelly. It is generally treated as a theoretical ceiling rather than a target.
- Consider a fraction. Quarter-Kelly is one example starting point referenced by traders. Adjustments may be considered only after live trading suggests the edge is real.
- Recalculate quarterly. Edges change. Sizing may need to change with them.
The bigger lesson
Picking the right trade is necessary. It's just not sufficient.
Kelly's real gift isn't the formula — it's the mindset shift. It can prompt traders to admit their edge is finite, their estimates are noisy, and their survival may depend on not blowing up before the math works in their favour.
Get the size right, and a modest edge may compound into something meaningful. Get it wrong, and even a strong signal might not save the account.
Sizing may matter more than the setup.
Risk warning: Trading involves substantial risk and you can lose money. This article is for educational purposes only and does not constitute financial or investment advice. It does not recommend specific trades or position sizes. Consult a licensed financial advisor for personalised guidance.