
The crisis of faith

Sahil Shah
February 13, 2026
2
min read
Bitcoin on 5th February slumped below $72,000, hitting levels not seen in 15 months (Oct ’24). This has triggered a "crisis of faith" among retail investors, with over $460 billion in total crypto market value wiped out in just a week.
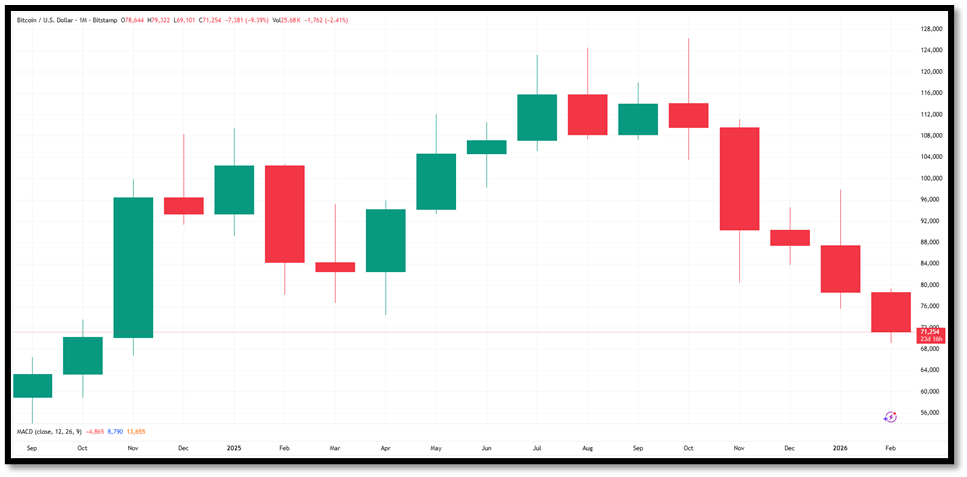
Institutional analysts argue that Bitcoin has matured into a macro asset. It is no longer driven solely by supply shocks from halving, but by global liquidity and Federal Reserve policy. Historically, 2025 should have been a peak year, but the decline has many wondering if institutional ETFs have "tamed" Bitcoin’s volatility or simply broken its old patterns.
In the Bitcoin's correlation with the Nasdaq has hit record highs, around 0.75, leading to the popular nickname: "Leveraged QQQ in a hardware wallet."
The nomination of Kevin Warsh as the next Federal Reserve Chair in late January has sent shockwaves through the market.
The 4-year cycle isn't dead; it has simply been swallowed by the much larger Global Liquidity Cycle.
Bitcoin at $65,000 is not just a price point; it is a message. It tells us that digital assets have graduated to the big leagues of macro-finance, but the "tuition" for that graduation is the loss of its status as an outsider.

February 13, 2026
8
min read
In the world of short-term trading, time is a luxury you don’t have. While fundamental analysis - studying earnings, GDP, and supply chains - is crucial for long-term investors, it is often too slow for the trader looking to capture a quick move in the markets.

Mohak Khemka

February 6, 2026
5
min read
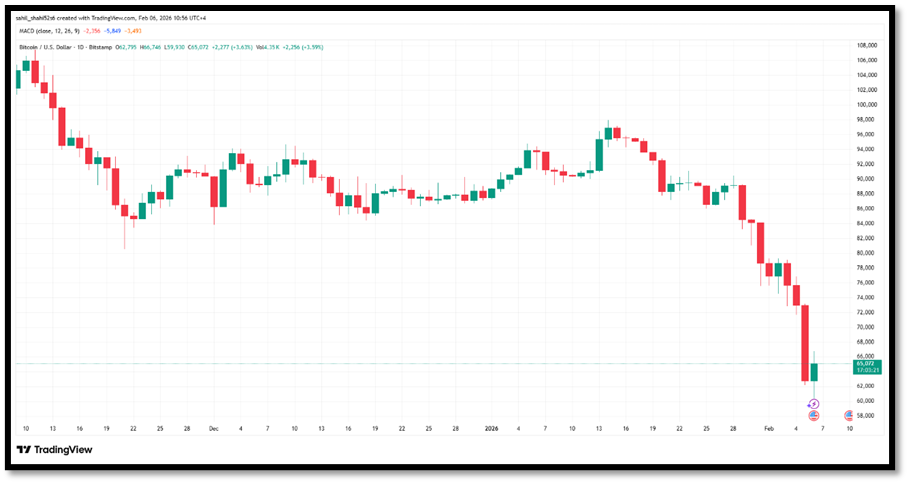
Since October, crypto markets have lost almost half of their value — $2.2 trillion of market cap gone in weeks. In past cycles, drawdowns could be linked to clear triggers like the FTX collapse or rate hikes. This time, fundamentals haven’t changed much.

Manaf Zaitoun


Comments (-)