Oil surge and gold crash: Iran hormuz impact
Strait of Hormuz closure sent oil up 13%. Gold rallied to $5,400 then fell below $5,000. Why second-order effects beat safe-haven narratives.

By Prakash Bhudia · Global Trading Strategist & Technical Markets Expert
4 March 2026 · 7 min read

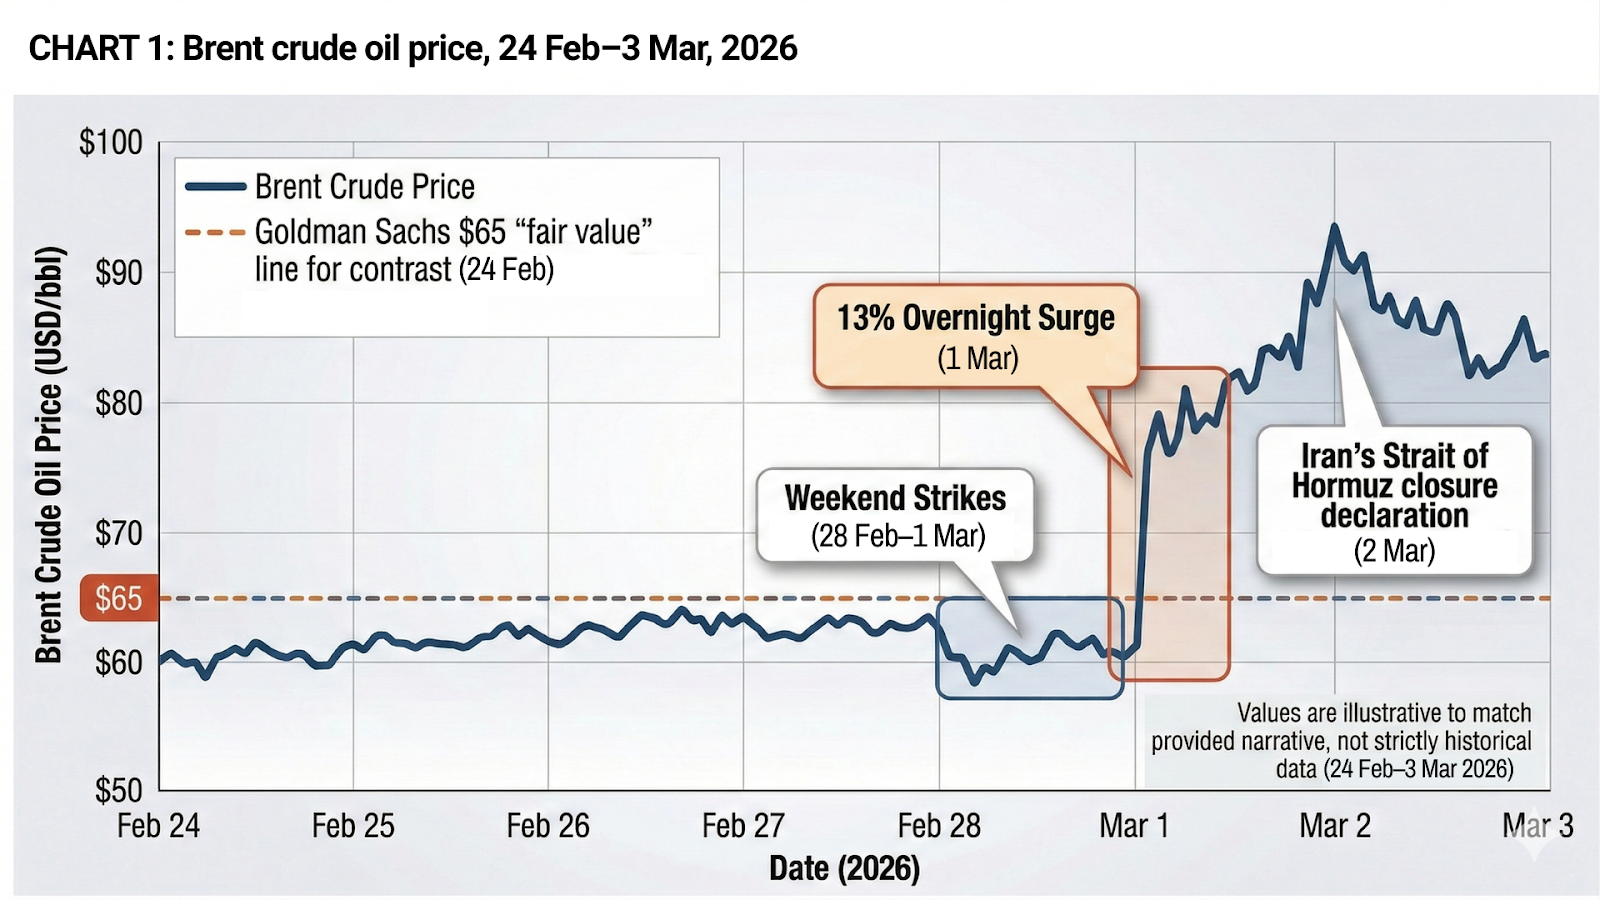
Over the weekend, the United States and Israel launched coordinated strikes on Iran. Iran retaliated. QatarEnergy halted LNG production after its Ras Laffan facility was hit. Shipping through the Strait of Hormuz — the chokepoint for roughly 20% of global oil supply — has dropped to effectively zero. Iran’s Revolutionary Guard declared the strait closed and struck at least seven vessels.
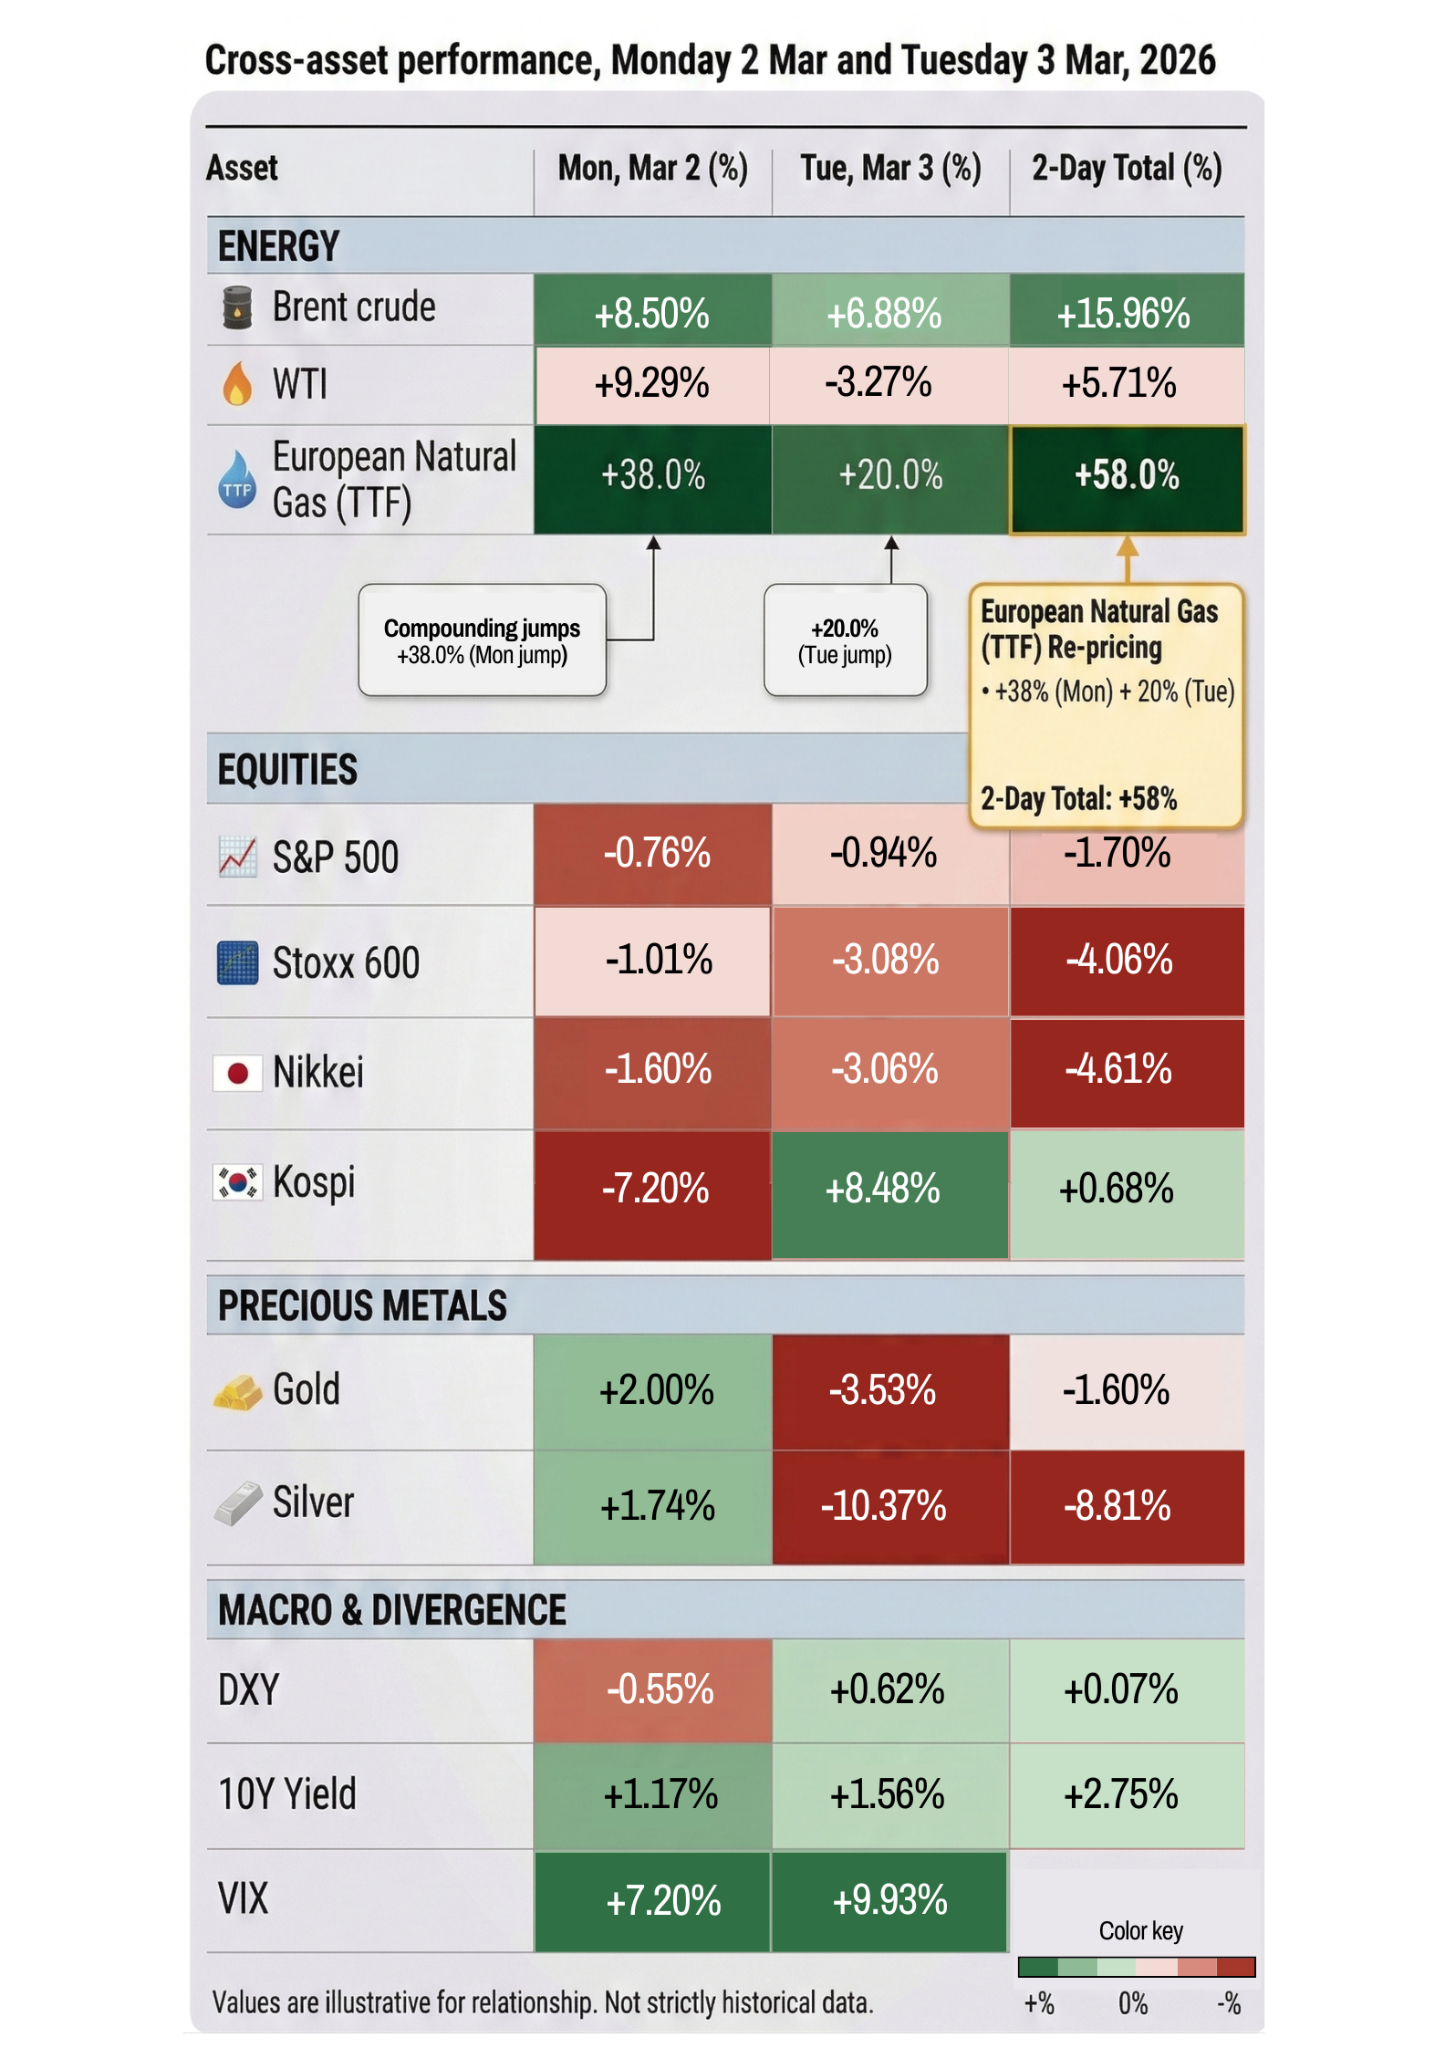
Two days into the market response, every asset class is moving. Most of them are not moving the way the textbooks say they should.
The scorecard so far
Oil has surged over 13% since Sunday night. Brent crude hit the high $70s — its highest since January 2025. European natural gas jumped 38% on Monday and another 20% on Tuesday. Diesel futures are up nearly 25% in two sessions. Goldman Sachs estimates the current oil price implies the market is pricing a supply disruption lasting roughly four weeks. If it goes longer, analysts are warning of $100 oil and comparisons to the 1970s energy crisis.
Equities have been whipsawing. The Dow dropped 600 points on Monday morning, then recovered to close down just 73. On Tuesday it plunged 1,200 points before clawing back to close roughly 400 lower. The S&P 500 fell about 1% on Tuesday after being down over 2.5% earlier in the session. South Korea’s Kospi, returning from a holiday, crashed 7.2% — its worst day since April 2025. European markets fell over 3%.
The VIX hit its highest level in three months.
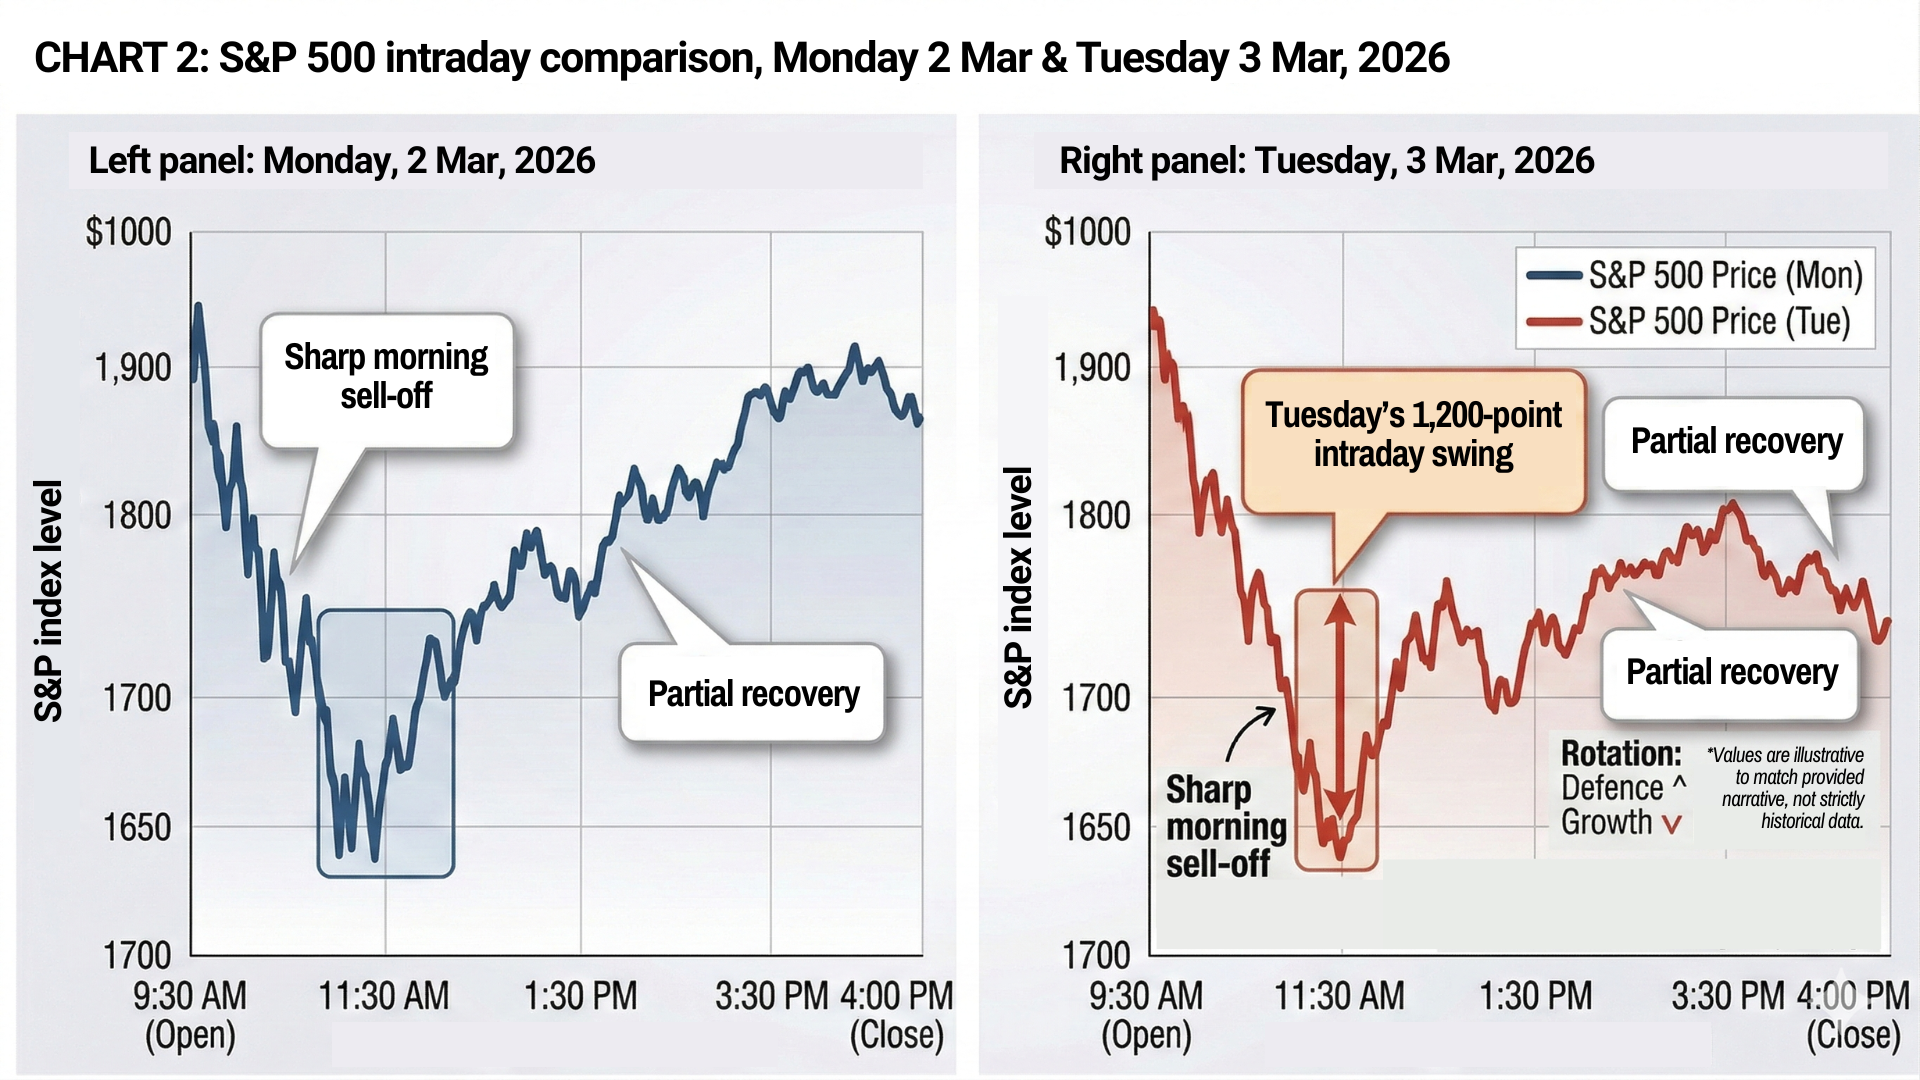
Defence stocks are surging. Lockheed Martin up 6%. AeroVironment up 10%. South Korean defence names up 20–30%. Airlines are getting destroyed — United down 6%, American and Delta down 5%. The rotation from growth into safety has been violent and immediate.
The gold paradox
This is where it gets interesting.
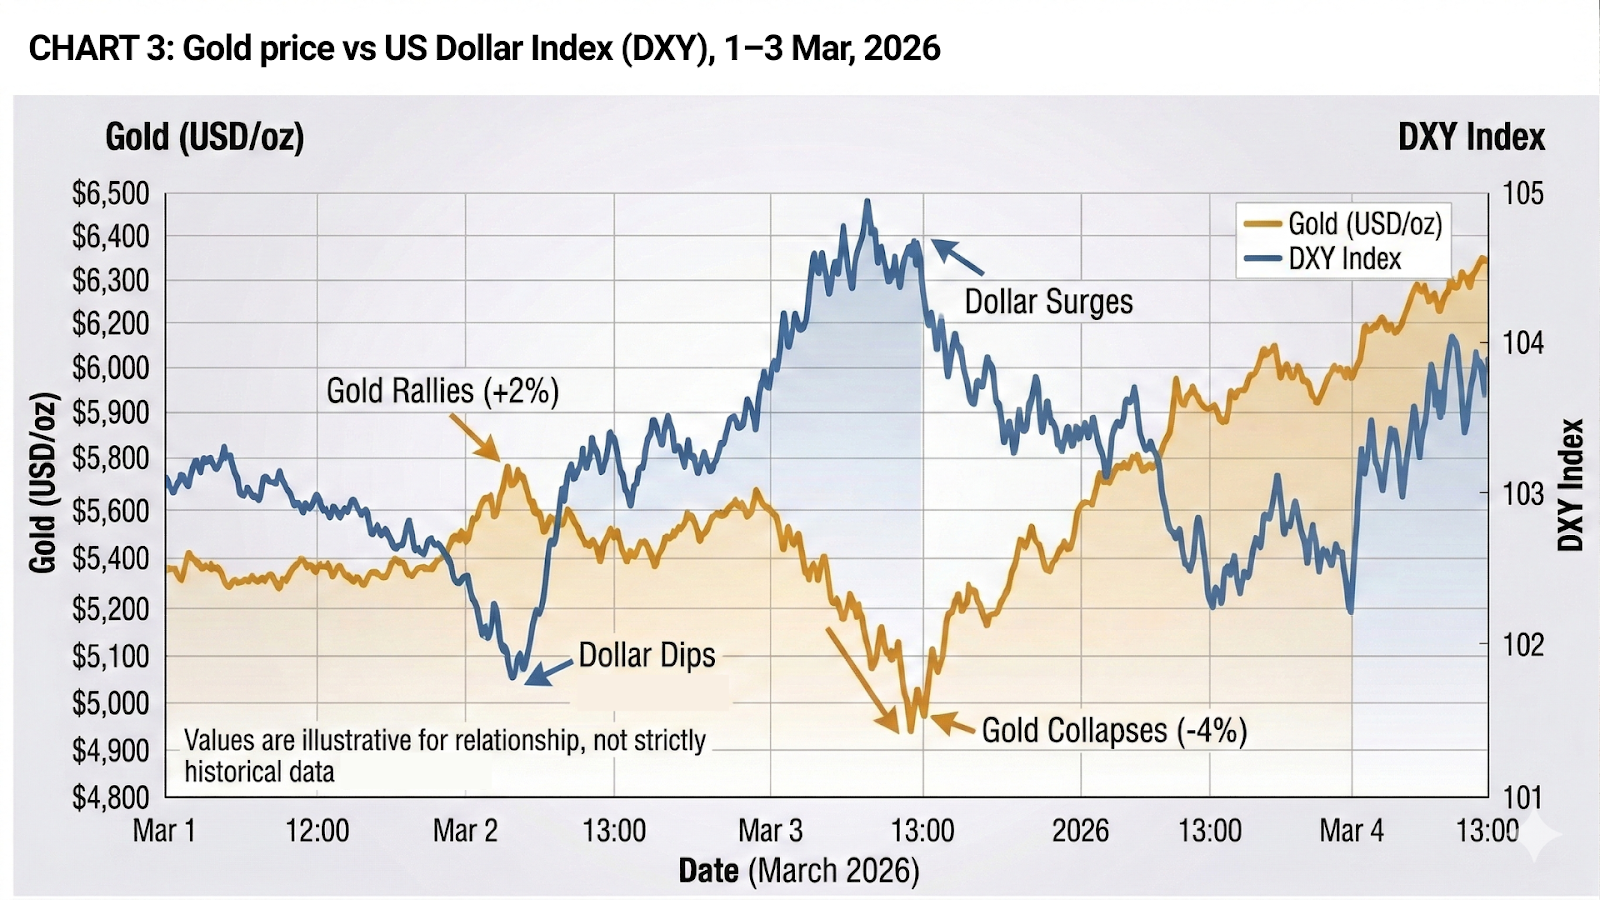
Gold is supposed to be the safe haven. It is the asset you own when the world is on fire. And on Monday, it performed exactly as expected — rallying 2% to briefly touch $5,400, its highest in a month.
Then on Tuesday, gold reversed and fell over 4%, dropping below $5,000. Silver — still fragile from its 40% intraday crash five weeks ago — fell more than 9%.
The reason is the second-order effect that catches most traders off guard. The war pushed oil higher, which pushed inflation expectations higher, which pushed rate cut expectations lower, which pushed the dollar higher, which pushed gold lower. The macro liquidity dynamic overwhelmed the safe-haven narrative. Gold went up on fear. Then it went down on the consequences of that fear.
JP Morgan still forecasts gold at $6,300 by year end. But in the short term, gold is not behaving like a hedge. It is behaving like a risk asset caught in a cross-current of conflicting forces.
Silver: Fragility compounding
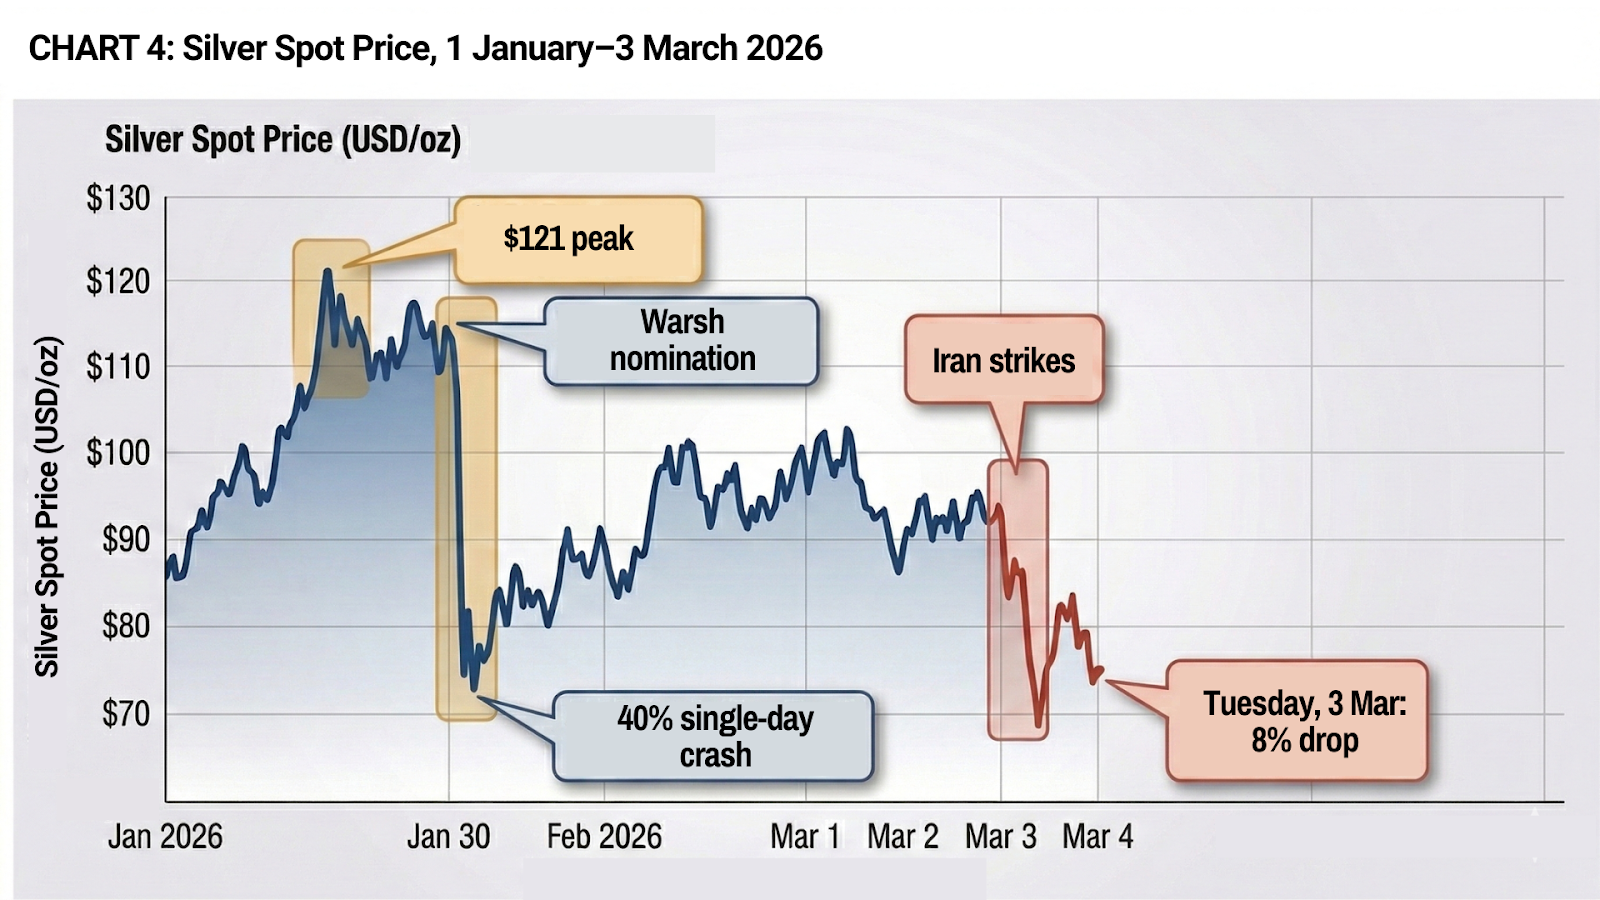
Silver’s 8% drop on Tuesday deserves particular attention. This is a metal that was above $121 five weeks ago, crashed nearly 40% in a single day on the Warsh nomination, and is now falling again during an active military conflict — the exact scenario where precious metals are supposed to provide protection.
The explanation is structural. Silver carries heavier leverage, thinner liquidity, and significant industrial demand alongside its precious metal status. When positioning unwinds, the cascade is faster and deeper than gold. Mining stocks are reflecting this — Hecla Mining down 15%, Coeur Mining down 13%, Hycroft down 17% on Tuesday alone.
For traders, the silver story is not really about Iran. It is about a market that has been structurally destabilised by the January blow-off and has not yet found its footing. Every new shock — whether it is a Fed nomination or a war — re-exposes the same underlying fragility.
What the market is actually pricing
Step back from the individual moves and the picture becomes clearer.
Oil is pricing a four-week supply disruption. If Hormuz reopens within that window, oil comes back down. If it doesn’t, the market is significantly mispriced and we are looking at a much larger repricing event across everything from energy to consumer spending to central bank policy.
Equities are pricing a short war. The S&P 500 is down roughly 1.7% from last week. That is noise by historical standards. Carson Group’s analysis of 40 major geopolitical events over 85 years shows the S&P 500 averaging a 0.9% decline in the first month, followed by a 3.4% gain over six months. The market’s base case is that this resolves. If it doesn’t, the repricing will be much more severe.
Bonds are pricing inflation, not safety. The 10-year Treasury yield is rising, not falling. This is unusual during geopolitical conflict and reflects the market’s fear that higher energy costs will feed through to prices and keep the Fed on hold for longer. Some analysts are now saying rate cuts for 2026 may be off the table entirely if the conflict persists.
Gold is pricing confusion. It rallied, then reversed. The conflicting forces — safe-haven demand pulling up, dollar strength pulling down — are cancelling each other out in real time. time.time.
Where does this go from here?
The honest answer is that it depends almost entirely on Hormuz.
If the Strait reopens within weeks and the conflict is contained, this looks like April 2025 all over again — a sharp volatility shock followed by a recovery. Oil pulls back. Equities rally. Gold settles. The VIX comes down. Traders who bought the dip are rewarded.
If the Strait stays closed and the war escalates — Trump has said the US will prosecute the war for as long as necessary, and Rubio has said the hardest hits are yet to come — we are in a different regime entirely. $100 oil becomes plausible. Inflation expectations reprice. The Fed is forced to hold or even hike. Equities face a sustained repricing that has nothing to do with earnings or AI and everything to do with energy costs flowing through the real economy.
The market is currently betting on the short war. But the market was betting on contained tariffs in April 2025 too, right up until it wasn’t.
What traders should be watching trading platform
Hormuz shipping data. If tanker traffic resumes — especially after Trump’s offer of Navy escorts and insurance guarantees — that is the single most important de-escalation signal for markets. Kpler data currently shows traffic at near zero.
Oil above $85 Brent. If Brent sustains above $85, the inflation pass-through becomes harder to ignore and the bond market will start repricing Fed expectations more aggressively. That is the level where the equity market stops shrugging.
The VIX structure. The VIX is elevated but not panicked — still well below the 60+ levels of April 2025 or the January silver crash. If the term structure inverts (short-term vol exceeding long-term vol), that signals the market is shifting from “transient shock” to “regime change.” We are not there yet.
Gold’s direction. If gold starts rallying alongside the dollar, it means the safe-haven bid has overwhelmed the macro liquidity headwind. That would signal genuine fear, not just repositioning.
The bigger pattern market volatility
This is the third major volatility shock in less than 12 months. The April 2025 tariff crash. The January 2026 silver blow-off. Now a Middle Eastern war.
Each time, the trigger was different. Each time, the market’s response was shaped as much by positioning and microstructure as by the event itself. Equities have recovered from every shock so far. But each one has left residual fragility — in precious metals positioning, in leveraged structures, in the implicit assumption that every dip gets bought.
The question is not whether markets can absorb this shock. They probably can, if it stays short. The question is what happens to a market that has absorbed three major shocks in a year when the fourth one arrives — and it doesn’t resolve quickly.
That is the tail risk nobody is pricing.
DIsclaimer: The performance figures quoted are not a guarantee of future performance.