The three ways I still lose money even when my macro read is right
A learner’s reflection on real June–July 2026 trades. Plus the journal prompts and a simple AI tool to plug execution leaks.
By Priyanka Joshi · Vice President of Content & Marketing at Deriv
29 July 2026 · 9 min read
Share
A while ago, I wrote about how I built an AI macro dashboard for FOMC week — where I wrote about how I use AI to compress economic calendars, news, and scenarios into something I can actually trade from. That piece was keeping myself informed and prepared. This piece is about what happens after that: the uncomfortable reality that you can have a decent macro read and a solid dashboard and still leak money on execution.
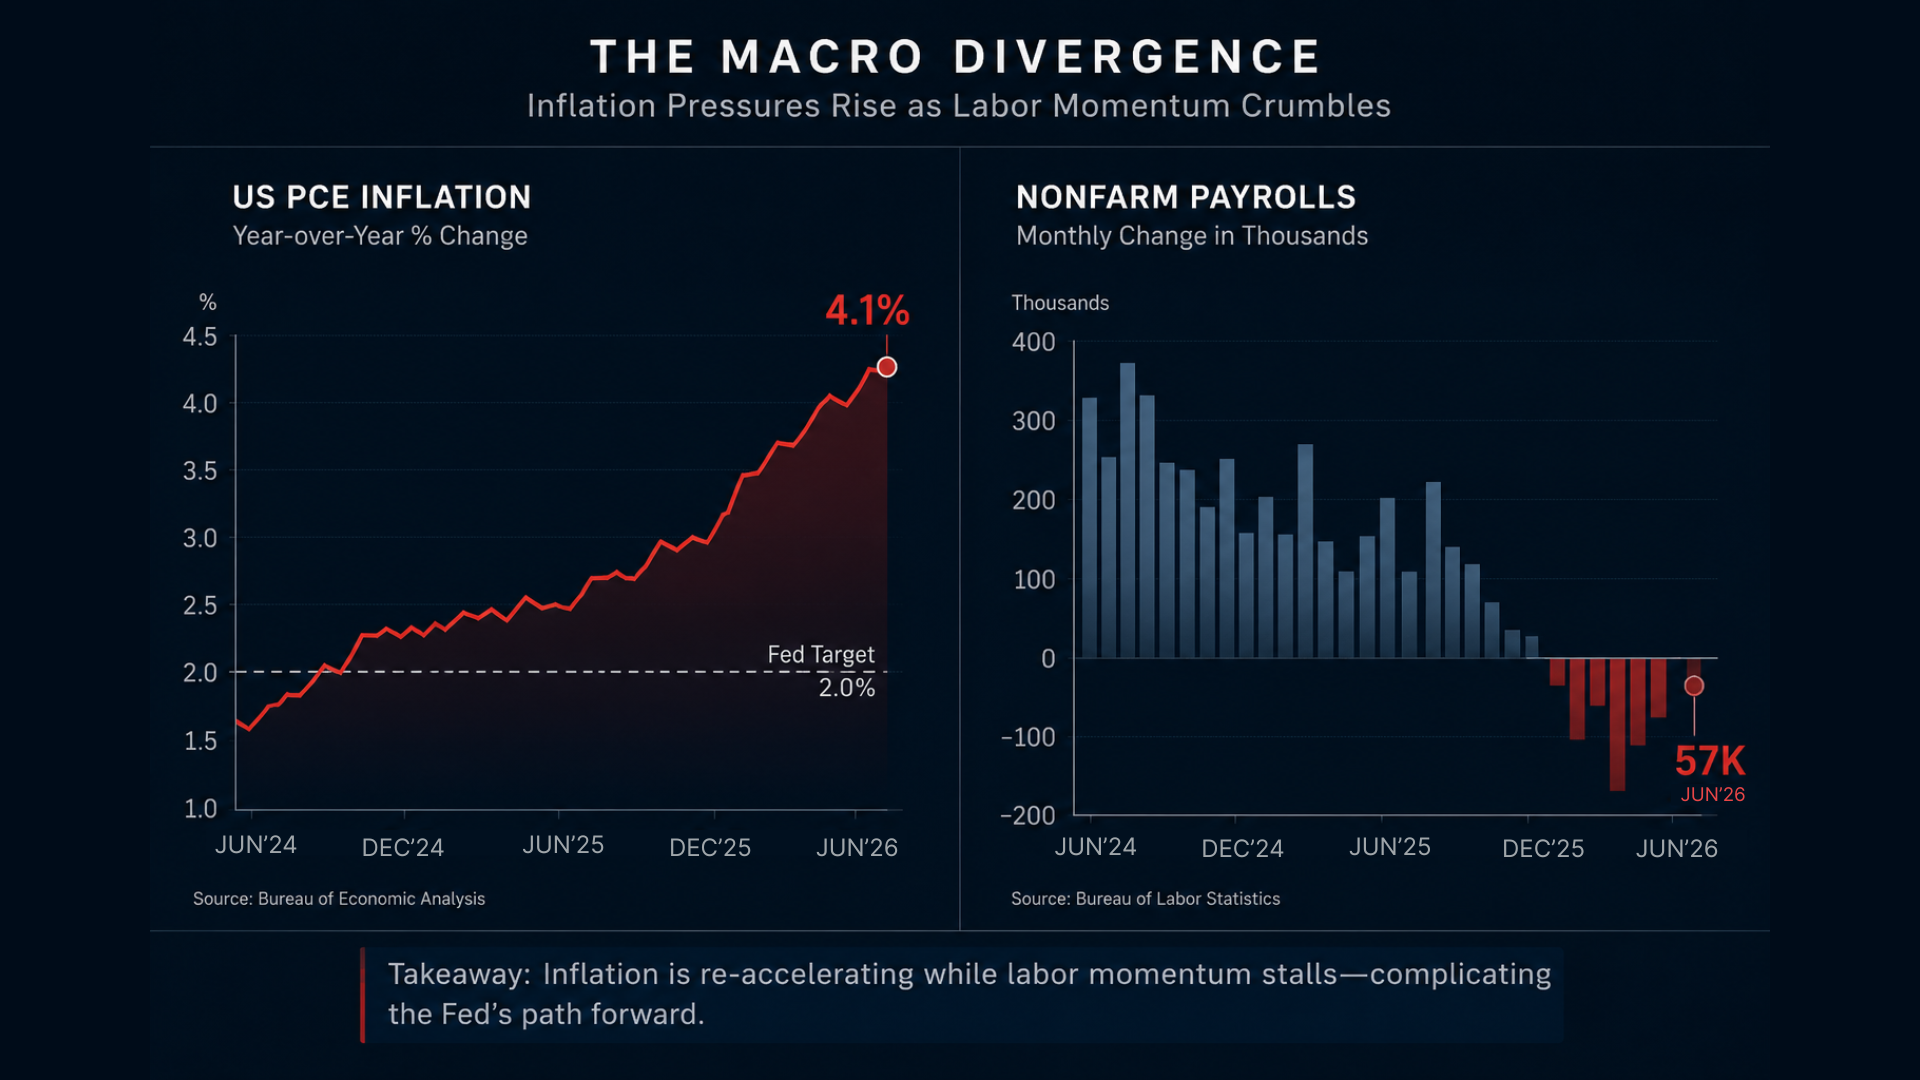
In June and early July 2026, the backdrop was clear enough even for a learner like me to form a view: US PCE inflation for May ran at 4.1% year‑on‑year, the highest since April 2023, while June nonfarm payrolls rose by just 57,000, far below the roughly 110,000 the market had been expecting. That’s a classic “sticky inflation meets cooling jobs” tension.
US PCE inflation accelerated to 4.1% while June nonfarm payrolls slowed to just 57,000, illustrating the conflicting macro signals that shaped trading conditions in June–July 2026.
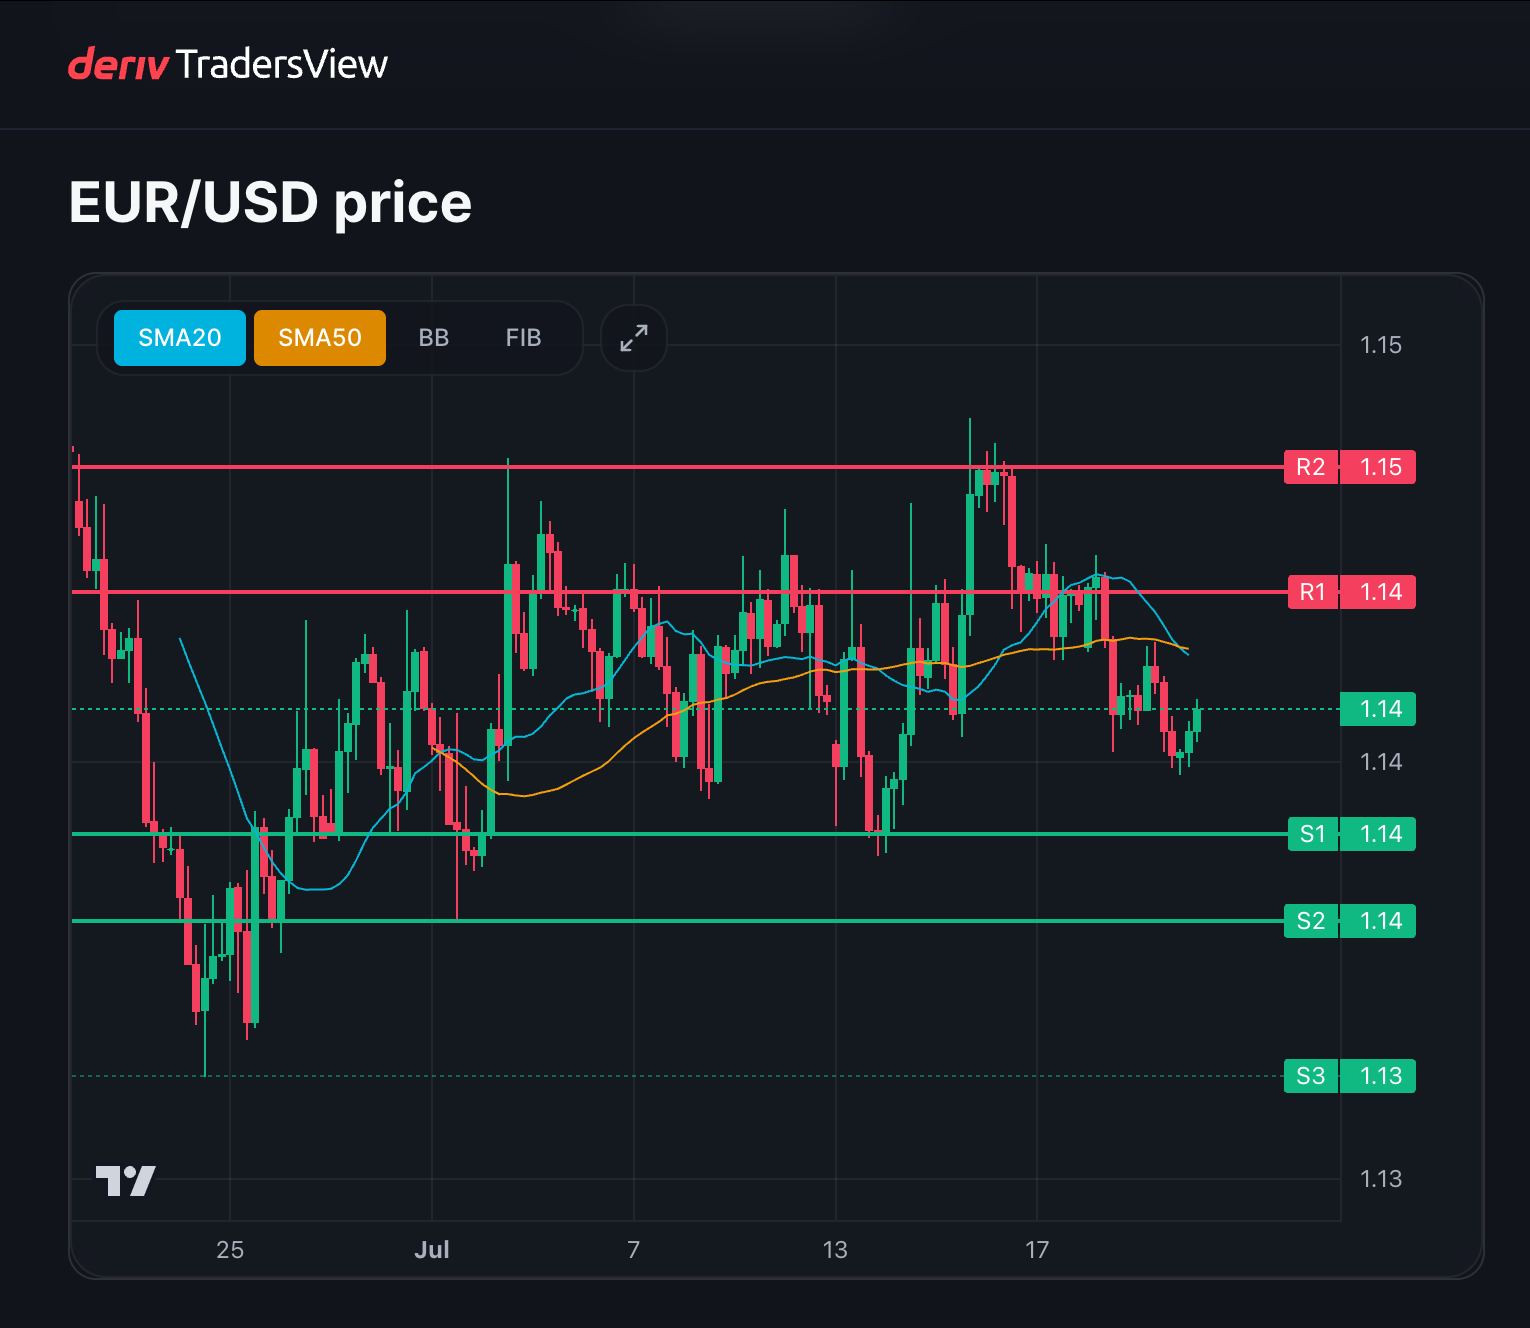
Around the same time, EUR/USD was trading near 1.14 in late June, and gold was still holding just above $4,000 into the month‑end. These were real, tradeable macro conditions. My problem wasn’t seeing them. My problem was turning those reads intotrades without bleeding from timing, size, and psychology.
To speed up learning, I now keep a detailed trade journal and feed the raw notes into a simple local Python script. It uses a small, open‑source language model running privately on my machine to summarise recurring behaviour patterns and flag emotional language like “should move soon,” “just this once,” or “feels big.” It doesn’t generate trades. It just helps me see the parts of my process that are still failing.
Here are the three main ways I still lose money even when my macro view is roughly right, and the rules, prompts, and AI workflow that finally started to plug the leaks.
1. Timing: right view, wrong day
In late June, I was bearish EUR/USD and wanted to express a stronger‑dollar view while the pair was trading around 1.14. Inflation was still hot, the Fed had room to sound firm, and the narrative supported a softer euro. Directionally, the view wasn’t crazy.
I treated a multi‑day macro thesis like a “should move soon” scalp. I shorted without a specific price trigger, the pair chopped sideways first, hit my stop, and only later drifted in the direction I’d expected. My journal entries from that week are full of phrases like “it should drop soon” and “I don’t want to miss the move.”
The issue was timing discipline, not analysis.
Rule I now use for timing: For any macro‑biased trade, I need a specific tactical trigger on the 4H or daily chart — a decisive close, a clean break‑and‑retest, or momentum confirmation.
No trigger = no trade.
Maximum patience window: 5 trading days.
If nothing triggers in that window, the idea goes back to the watchlist.
One extra example you can steal. I now force myself to write two separate lines in the journal before any macro trade:
“Macro view:” one sentence about the bigger story.
“Entry condition:” one sentence about the actual price pattern I’m waiting for.
If those two lines don’t match, I don’t trade. It sounds simple, but it has already saved me from multiple “right view, wrong day” losses.
EUR/USD traded around the 1.14 level in late June 2026, where a bearish macro view ultimately proved correct—but only after an early entry resulted in a stopped-out trade.
2. Risk: conviction is not a sizing model
My second big leak is letting a strong story bully me into oversizing. When a headline feels obvious, I start behaving as if conviction reduces risk. In practice, it does the opposite.
This shows up most clearly in markets like crude and gold, where the macro story always feels urgent. In June and July, oil was still deeply tangled up in inflation and geopolitical risk, and gold was flirting with the 4,000 line. There was no shortage of narrative fuel.
If I let that narrative drive size, a normal pullback becomes a career‑ending event in my head.
Rule I now use for risk:
Risk a maximum of 1% of equity per trade.
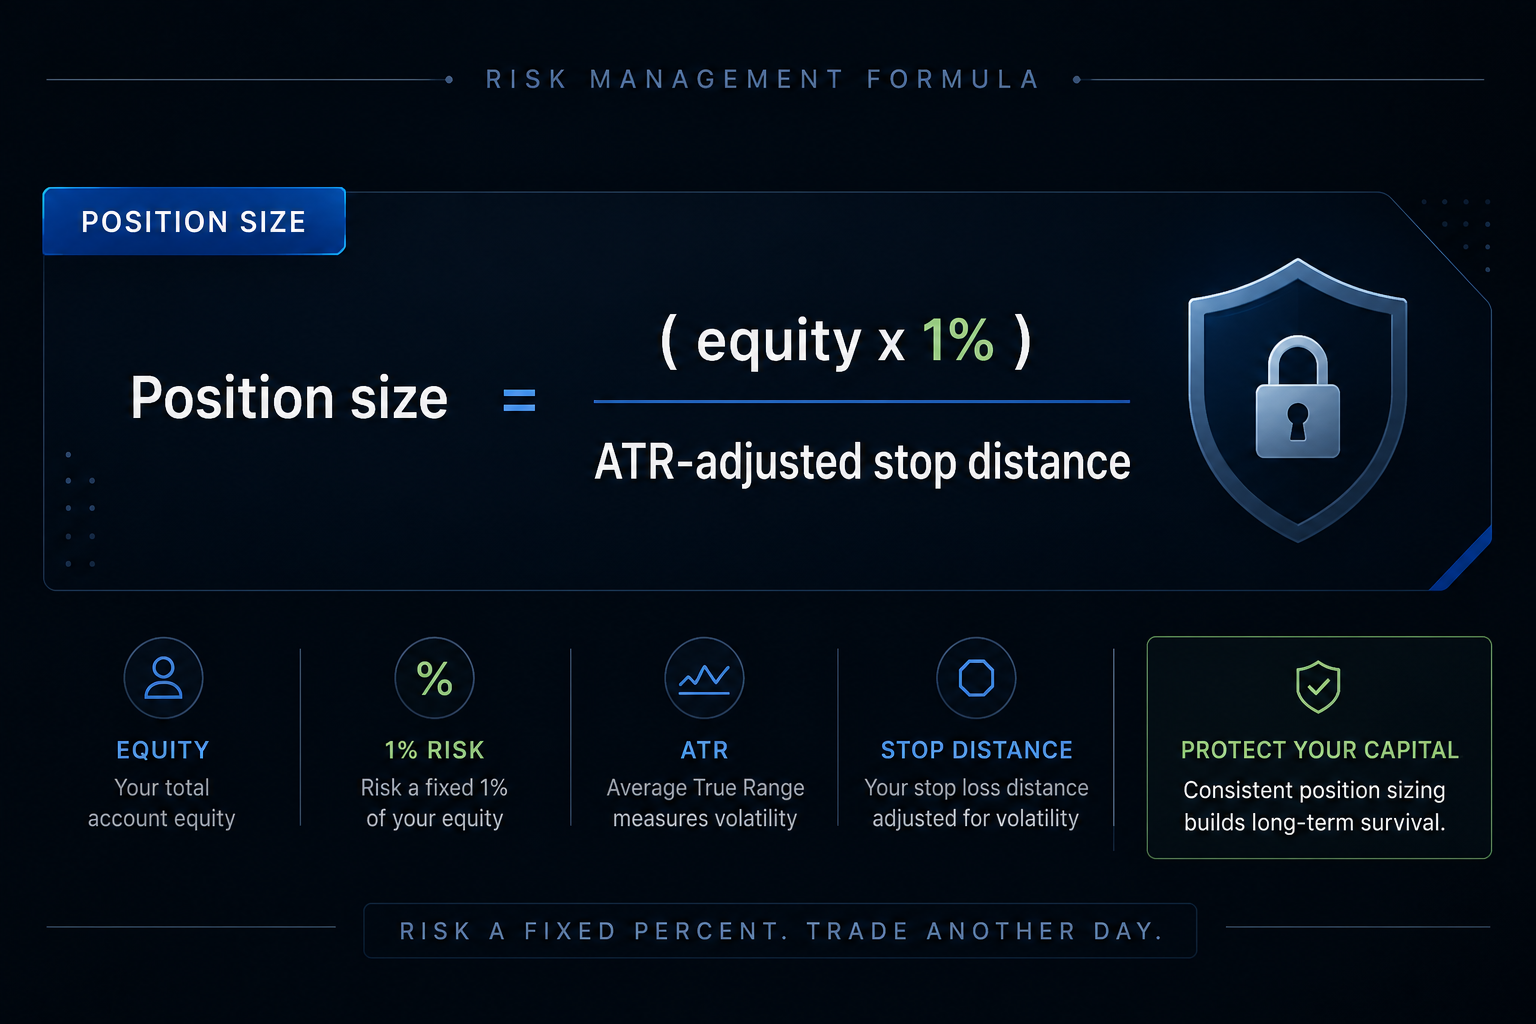
Position size = (equity × 1%) ÷ ATR‑adjusted stop distance.
Log the exact dollar risk in the journal before entry. No exceptions.
A simple position-sizing formula helps limit each trade to 1% of account equity, adjusting exposure based on volatility rather than confidence alone.
I still have conviction. I just no longer let it touch the sizing formula.
One extra example you can steal: Right before a “high‑conviction” trade, ask: “If this pulls back normally before working, can I sit through it without touching the stop?”
If the honest answer is “no,” the position is too big.
I resize until I can say “yes” and mean it.
3. Psychology: when a good thesis becomes a bad excuse
The third leak is purely psychological: using a good thesis to justify breaking my own rules.
Gold is my favourite example. At the end of June, gold was closing just above $4,000, with enough macro tension around inflation and growth to justify almost any narrative. When you trade something that can always be explained by “macro,” it becomes dangerously easy to widen stops, add size, or hold longer “because the story still makes sense.”
I’ve done all three.
In one short trade that went against me, I had a clear stop when I entered. When the market moved against me after a data release, I widened the stop and told myself “the macro is still good.” The story didn’t change; my discipline did. That single decision turned a manageable loss into something I had to spend days digging out of.
Rule I now use for psychology:
Moving a stop once is automatically logged as a rule break.
Any rule break or two consecutive losses triggers a mandatory 24‑hour trading pause.
During that pause, I review only journal entries and charts — no new orders.
I don’t pretend this rule eliminates emotion. It just keeps my worst decisions from compounding.
One extra example you can steal: If your journal entries after entry say “I still like the thesis” more than once, you’re probably no longer managing the trade but arguing with it.
I tag every such sentence. Seeing those tags in a cluster around big losses was the push I needed to enforce the 24‑hour pause.
The prompts that changed my journal
The single biggest upgrade wasn’t the AI script; it was moving from vague reflection to repeatable prompts.
After every losing trade, I now answer:
What was my macro view in one sentence?
What would have invalidated that view within 24 hours?
Was this loss caused by bad analysis or bad execution?
Did I enter because the setup triggered, or because I was tired of waiting?
What exact sentence did I tell myself before breaking the rule?
If I were flat right now, would I still take this trade here?
What one rule would have saved me the most money?
It’s not fancy. It just forces the loss into a category. “Bad trade” is too vague to fix; “early entry,” “oversized,” or “stop moved” is actionable.
How I actually use AI here
In my earlier FOMC dashboard article, AI was front‑and‑centre: it helped pull together calendars, speeches, and data into a single macro view.
Here, AI sits in the background.
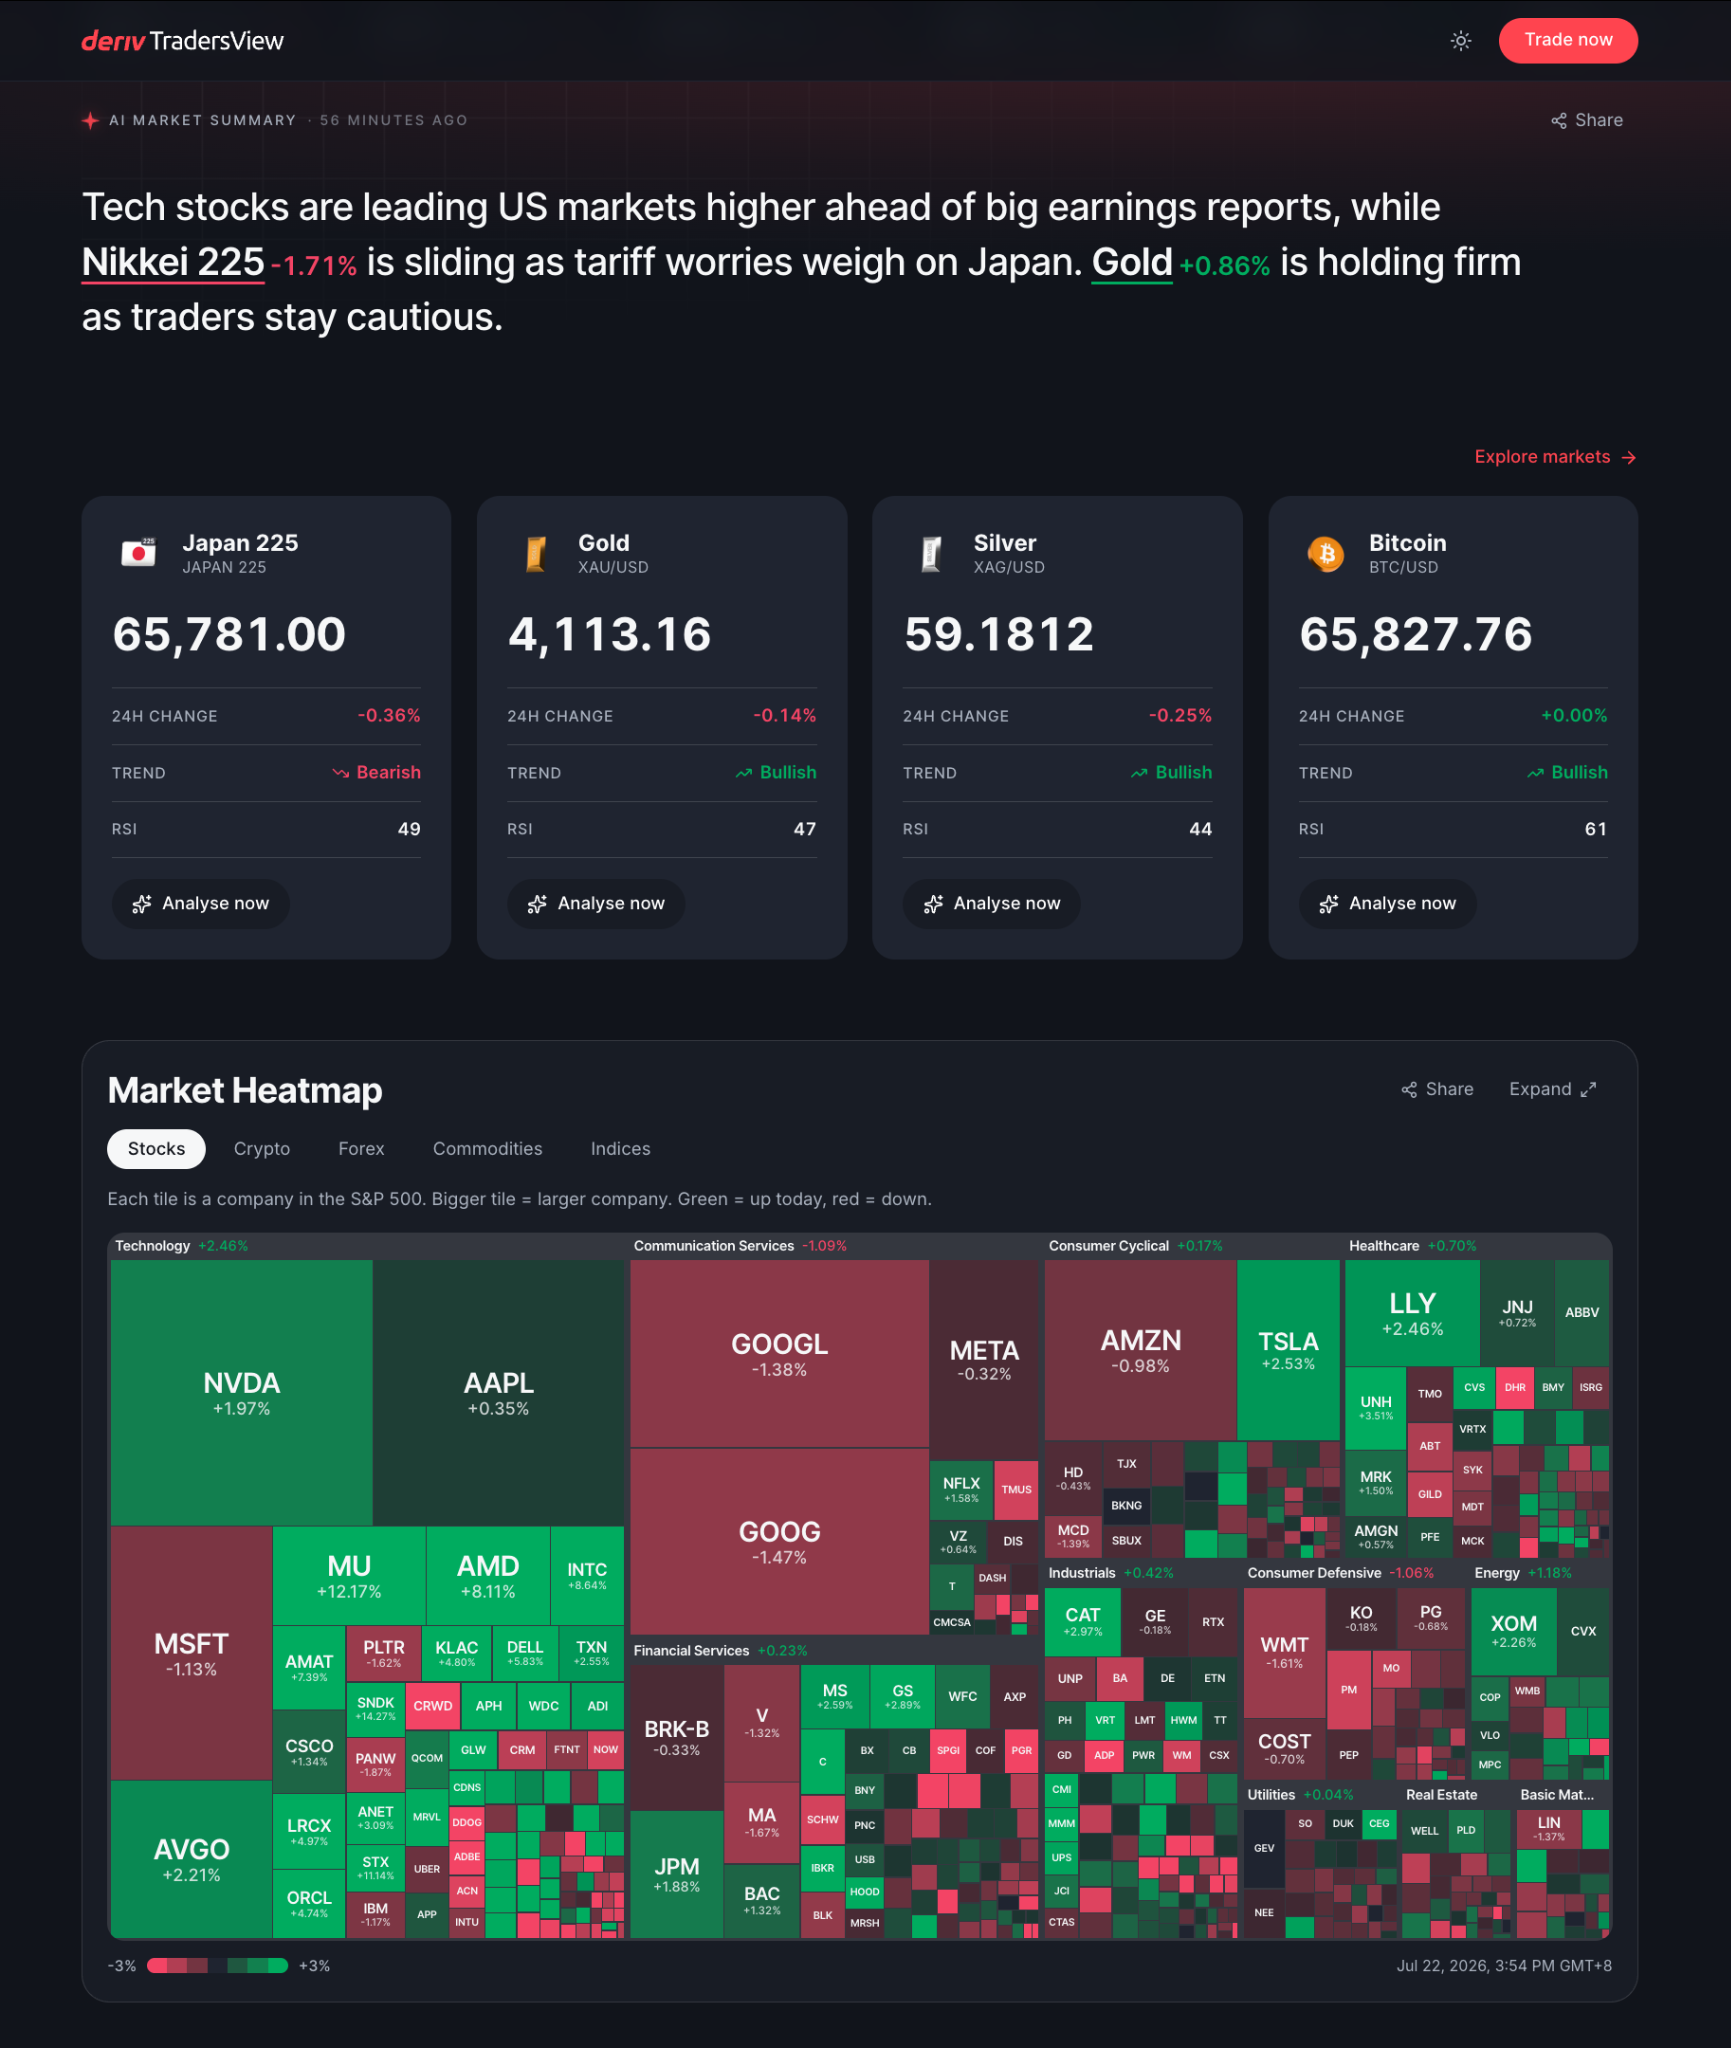
I trade and review my setups on tradersview.deriv.com, Deriv’s AI chart analysis tool and then export my journal into a simple CSV. All my prices, symbols, and notes come straight from my own account history and charts.
The author's workflow combines Deriv TradersView for market analysis with AI-assisted journal reviews, separating market research from post-trade behavioural analysis.
The AI model’s job is limited to three things:
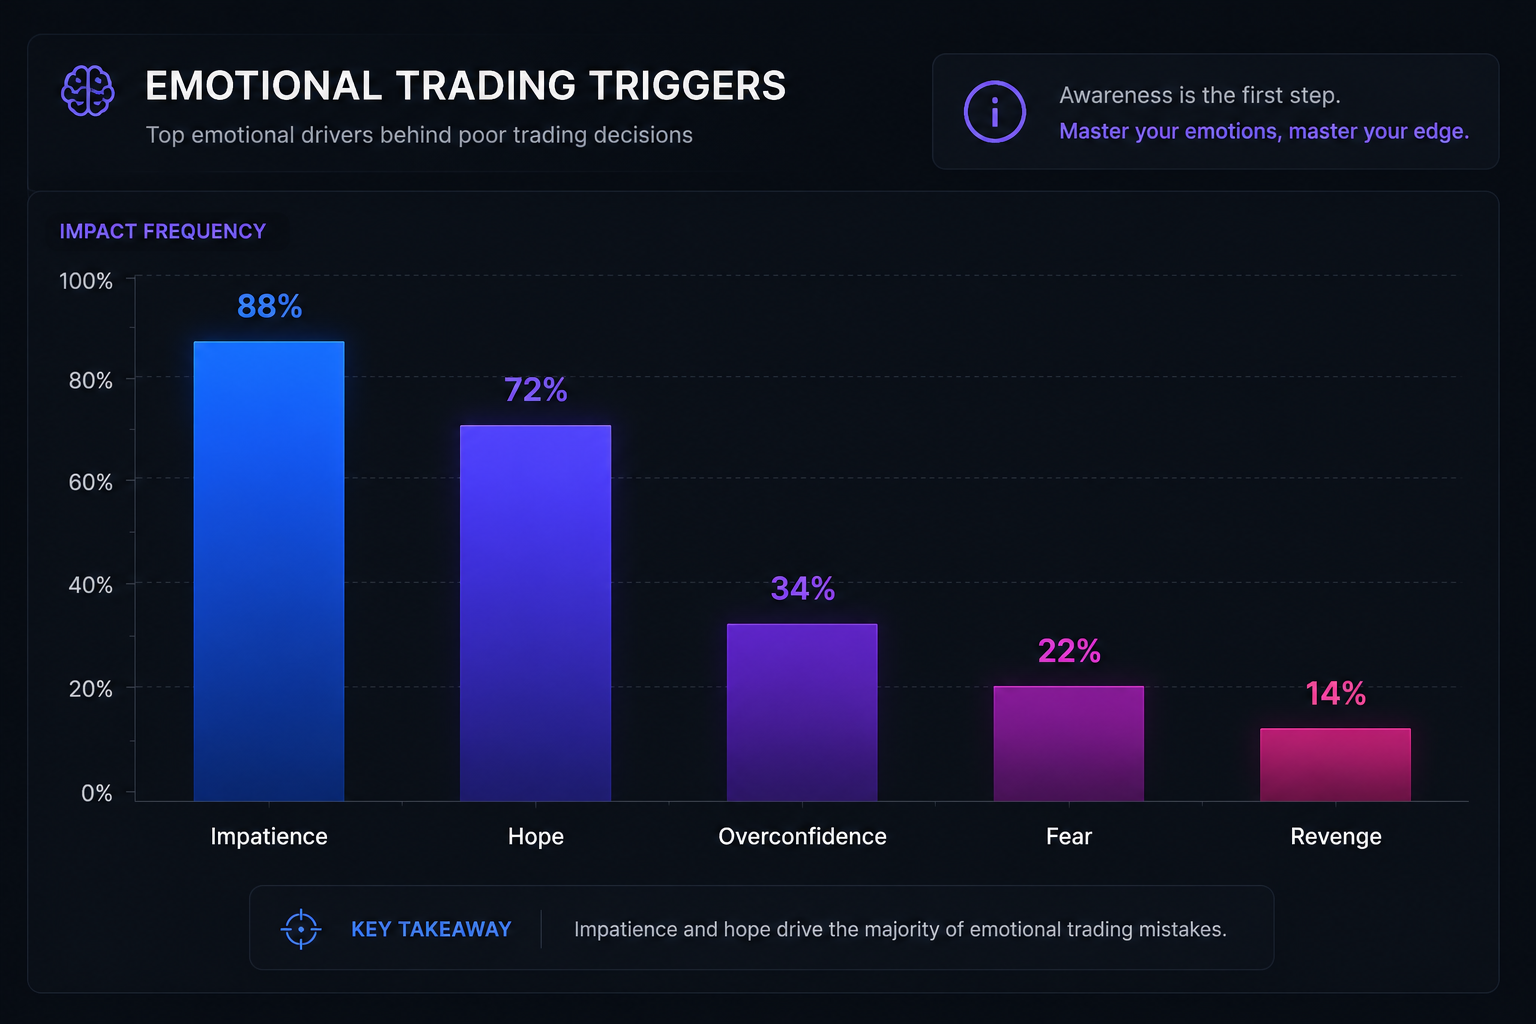
Flag emotional phrases in my notes (impatience, fear, revenge, hope, overconfidence).
Count how often each theme shows up around losing trades.
Tag whether losses sound like analysis errors (“thesis wrong”) or execution errors (“early, oversize, moved stop”).
AI groups recurring emotional language from trading journals—such as impatience, hope, fear, revenge, and overconfidence—to highlight the behavioural patterns most often linked to losing trades.
Typical prompts I use:
“Read the journal entries below. Identify repeated emotional language, especially fear, impatience, revenge trading, and overconfidence. Group them by theme and quote the exact phrases.”
“Review these 20 trades. Separate losses caused by analysis errors from losses caused by execution errors. Give me counts, examples, and the most common rule break.”
“Summarise this week’s journal in plain English. What were my three biggest behavioural leaks, and what is one concrete rule to test next week for each?”
I don’t ask what to trade. I ask where I keep hurting myself.
Pseudocode: how my AI journal helper actually works
I run my journal through a local Python script, but the logic is simple enough that you can build it in any language.
Here’s the workflow in plain pseudocode:
START
  READ "trade_journal.csv"
    COLUMNS: date, symbol, pnl, notes
  DEFINE EMOTION_SETS:
    impatience    = ["should move", "too early", "soon", "jumped in"]
    overconfidence = ["high conviction", "obvious", "easy trade"]
    fear          = ["scared", "nervous", "hesitated", "cut early"]
    revenge       = ["get it back", "make it back", "chase", "missed it"]
    hope          = ["it will come back", "just this once", "give it room", "macro is still good"]

  FOR EACH trade IN journal
    text = LOWERCASE(trade.notes)
    themes = EMPTY_SET
    FOR EACH (label, phrases) IN EMOTION_SETS
      FOR EACH phrase IN phrases
        IF phrase IS IN text THEN
          ADD label TO themes
        ENDIF
      ENDFOR
    ENDFOR
    IF text CONTAINS ANY OF ["early", "no trigger", "moved stop", "oversized", "cut early"] THEN
      error_type = "execution"
    ELSE IF text CONTAINS ANY OF ["wrong thesis", "missed macro", "data changed", "read was wrong"] THEN
      error_type = "analysis"
    ELSE
      error_type = "unclear"
    ENDIF
    ATTACH themes AND error_type TO trade
  ENDFOR
  COUNT how many times each theme appears across all trades
    OUTPUT "emotion_summary.csv" WITH COLUMNS: theme, count
  OUTPUT "journal_flags.csv"
    COLUMNS: date, symbol, pnl, themes, error_type, notes
END
That’s it. No magic.
The “AI” is just the Claude code model I use to help summarise and tag these themes — the real work is still in what I write and which rules I decide to enforce.
Please note that I’m not trying to land a brand‑new idea! “Timing, sizing, psychology” is the oldest trio in trading.
The reason I wrote it is simpler: I needed a way to make those three problems impossible to ignore in my own P&L. The macro dashboard gets me to “roughly right” on the big picture. This journal‑plus‑AI workflow is what I use to see all the ways I still mess it up in practice and to turn those leaks into rules I can actually follow.
If you’re in the same place — decent reads, messy execution — copy one rule, one prompt, or one small piece of this workflow this week at small size, and review it honestly.
You don’t need perfection but say yes to consistency.
Disclaimer: This is my personal trading journal reflection. I am not a financial advisor. Trading involves substantial risk of loss. Past performance isnot indicative of future results. All examples are from my own account, and market prices are based on my broker charts and notes.
Join 3M+ global traders
Open an account in minutes and start trading the world's markets — forex, stocks, indices, and more.