
Gold at $4,000: support or breakdown?
Gold briefly dipped below $4,000, its third test since June. What the cross-market sell-off suggests and which levels would change the reading.

Автор Prakash Bhudia · Global Trading Strategist & Technical Markets Expert
23 октября 2026 г. · 6 мин чтения

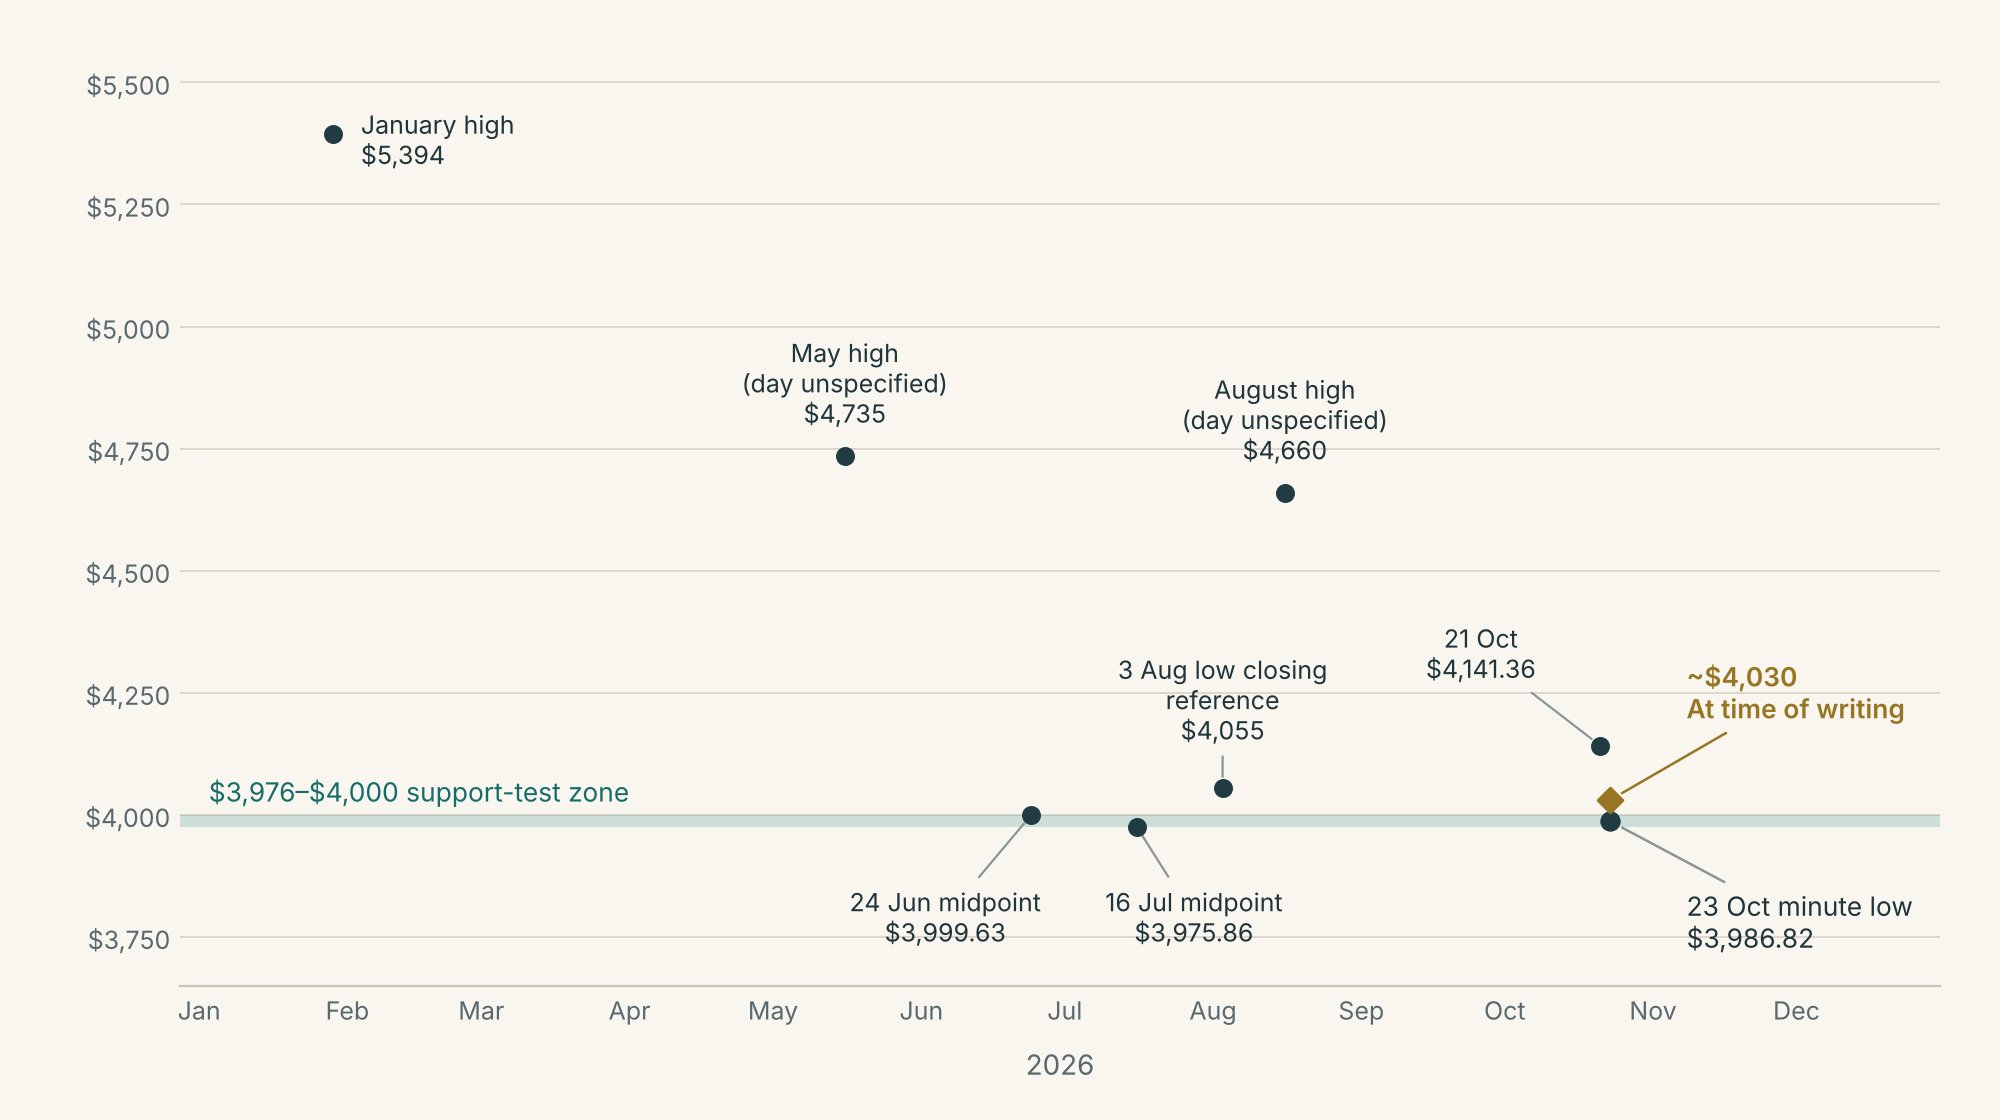
Gold dipped to $3,986.82 and rebounded to about $4,030 at the time of writing, the third broad visit to $4,000 since June. The latest selling extended across metals and US stocks while Treasury yields fell and the dollar barely moved. That looks more like a broad reduction in risk than a fresh dollar-and-rates shock.
The trend remains weak, but the dip has not established a lasting breakdown. Gold’s response to the next test of $4,000 matters more than the first breach.
Gold fell with other risk-sensitive markets
Gold’s weakness extended beyond its own market. The rise in VIX, a measure of expected stock-market volatility, accompanied falls in metals and equities.
| Market | Move | Window |
|---|---|---|
| Gold, XAUUSD | $4,141.36 → $4,023.61; -2.84% | 21 Oct 20:00 → 23 Oct 11:00 UTC hourly observations |
| Silver, XAGUSD | $57.969 → $53.897; -7.02% | Same hourly window |
| Copper futures | -2.76% | 21 → 22 Oct daily closes |
| S&P 500 | -1.21% | 21 → 22 Oct closes |
| VIX | 16.68 → 19.03 | 21 → 22 Oct closes |
| Ten-year Treasury yield | 5.146% → 4.953%; -19.3bp | 21 → 22 Oct, Cboe TNX |
| Dollar, US Dollar Index (DXY) | 101.78 → 101.61; -0.17% | 21 → 22 Oct closes |
Deriv hourly extracts and Yahoo Finance. Windows differ as shown; $4,030 is the separate time-of-writing quote.
The ten-year inflation breakeven fell from 2.37% to 2.32%. Subtracting it from nominal yields suggests real yields fell about 14 basis points. This estimate combines different sources, but points away from rising inflationadjusted rates as the explanation for gold’s fall.
The pattern is consistent with investors reducing risk; it does not establish forced liquidation.
The Fed explanation is mostly about later meetings
One market explanation is that geopolitical tensions are lifting oil prices, increasing inflation pressure and the prospect of Fed hikes. Yet Chicago Mercantile Exchange (CME) FedWatch put next week’s hike probability at 8.3%, versus 5.5% yesterday and 15.5% a week earlier.
The probability of rates being higher by December was 83.1%, up from 77.5% yesterday but below 89.0% a week earlier. Later tightening remains priced in; an imminent hike has not suddenly become the central expectation. These readings are from 23 October at 12:45 BST.
A weak trend can still produce a failed breakdown
Gold was near the same floor on 24 June ($3,999.63) and 16 July ($3,975.86).
Meanwhile, recorded highs stepped down from $5,394 in January to $4,735 in May and $4,660 in August. At $4,030, gold is about 25% below that January reference.
History argues against automatically chasing the weakness. In the 2011–2026 breakout study, gold was lower ten trading days after a downside 20-day break in 44% of cases, versus 47% after an ordinary day. That tested closes below prior 20-day lows, not brief crossings of round numbers.
Large drawdowns gave no simple answer either. A year after the gold-backed fund GLD first closed 25% below its running high in 2008, it was up 31.6%; the equivalent 2013 case ended down 4.4%. A deep fall alone did not identify a bottom.
GLD holdings fell 40.89 tonnes between gold’s 29 January peak and 22 October, including 8.27 tonnes over the latest week. That shows an outflow from one fund, not who caused the wider fall.
Money managers’ positioning was near its three-year 40th percentile on 13 October: not unusually crowded, but still vulnerable to selling. The 20 October positioning report is scheduled for 20:30 BST on 23 October.
The levels that would change the reading
| Area | What to watch |
|---|---|
| $3,976-$4,000 | A reclaim that survives a retest supports the floor. A close below followed by a failed reclaim supports a breakdown. |
| $4,055 | The 3 August low closing reference: an initial recovery level. |
| $4,149 / $4,285 | The 20-day average updated through 22 October, then the recent high reference. Recovering these would repair more of the decline. |
| $3,939 / $3,856 | November and October 2025 low observations, should the current floor fail. Reference points, not targets. |
The next scheduled tests are the 28 October Fed decision and 29 October Gross Domestic Product (GDP) and Personal Consumption Expenditures (PCE) releases. Watch whether the dollar and real yields reinforce gold’s price response.
A recovery becomes more convincing if gold holds the floor and breaks a recent lower high. A breakdown becomes more convincing if it loses the floor and cannot regain it; the first dip alone has not settled that question.
Sources and calculation notes
The $3,986.82 low appears in the 23 October 02:00 UTC bar of the saved Deriv MT5 trade-level quote extract (minute low field). The $4,030 quote is the time-of-writing reference supplied for this note. Daily midpoints are late-session observations, not full daily highs and lows; July’s intraday low is not established by the $3,975.86 observation.
Cross-market source snapshots are retained with the research files. The real-yield proxy is TNX minus FRED T10YIE: 5.146−2.37=2.776% on 21 October; 4.953−2.32=2.633% on 22 October, a 14.3bp decline. TNX is not identical to the Treasury constant-maturity series used to construct the breakeven, and timestamps can differ. FRED breakeven source. It is not presented as the published DFII10 observation.
The 22 October 20:54 UTC minute midpoint of $4,023.605 replaces the stale date-labelled row when updating the moving average: $4,149.23. The GLD drawdown comparison starts on 10 September 2008 and 15 April 2013, using the first close at least 25% below the running high within each episode. Returns end at the first available close on or after the following anniversary. GLD is a gold-price proxy, not XAUUSD; these are two historical illustrations, not a predictive base rate. Positioning percentile: 39.74%, using net longs divided by open interest against the preceding 156 reports.
Historical downside comparison: 198 signals and 4,083 comparison dates, through 15 October 2026. Closing-price outcomes, not trading win rates; windows can overlap. GLD holdings are issuer-reported tonnes. FedWatch probabilities are source-timestamped observations, not an assertion that a particular headline caused the repricing.
Short glossary
Real yield: the yield after allowing for inflation. Breakeven: the yield gap between ordinary and inflation-protected Treasuries, used as a market measure of inflation expectations. Basis point: 0.01 percentage point. Reclaim: moving back above a level. Retest: revisiting a recently crossed level. Lower high: a rally ending below the preceding rally’s peak. VIX: an options-based measure of expected S&P 500 volatility.
This content is not intended for EU residents. The performance figures quoted refer to the past, and past performance is not a guarantee of future performance or a reliable guide to future performance.