When gold's triple bottom holds, is the low really in?
Gold is defending a triple bottom near $3,973 after a sharp fall. Here is how to tell whether the macro trend or the floor's buyers are winning.
By the Deriv desk · 1 July 2026 · 4 min read

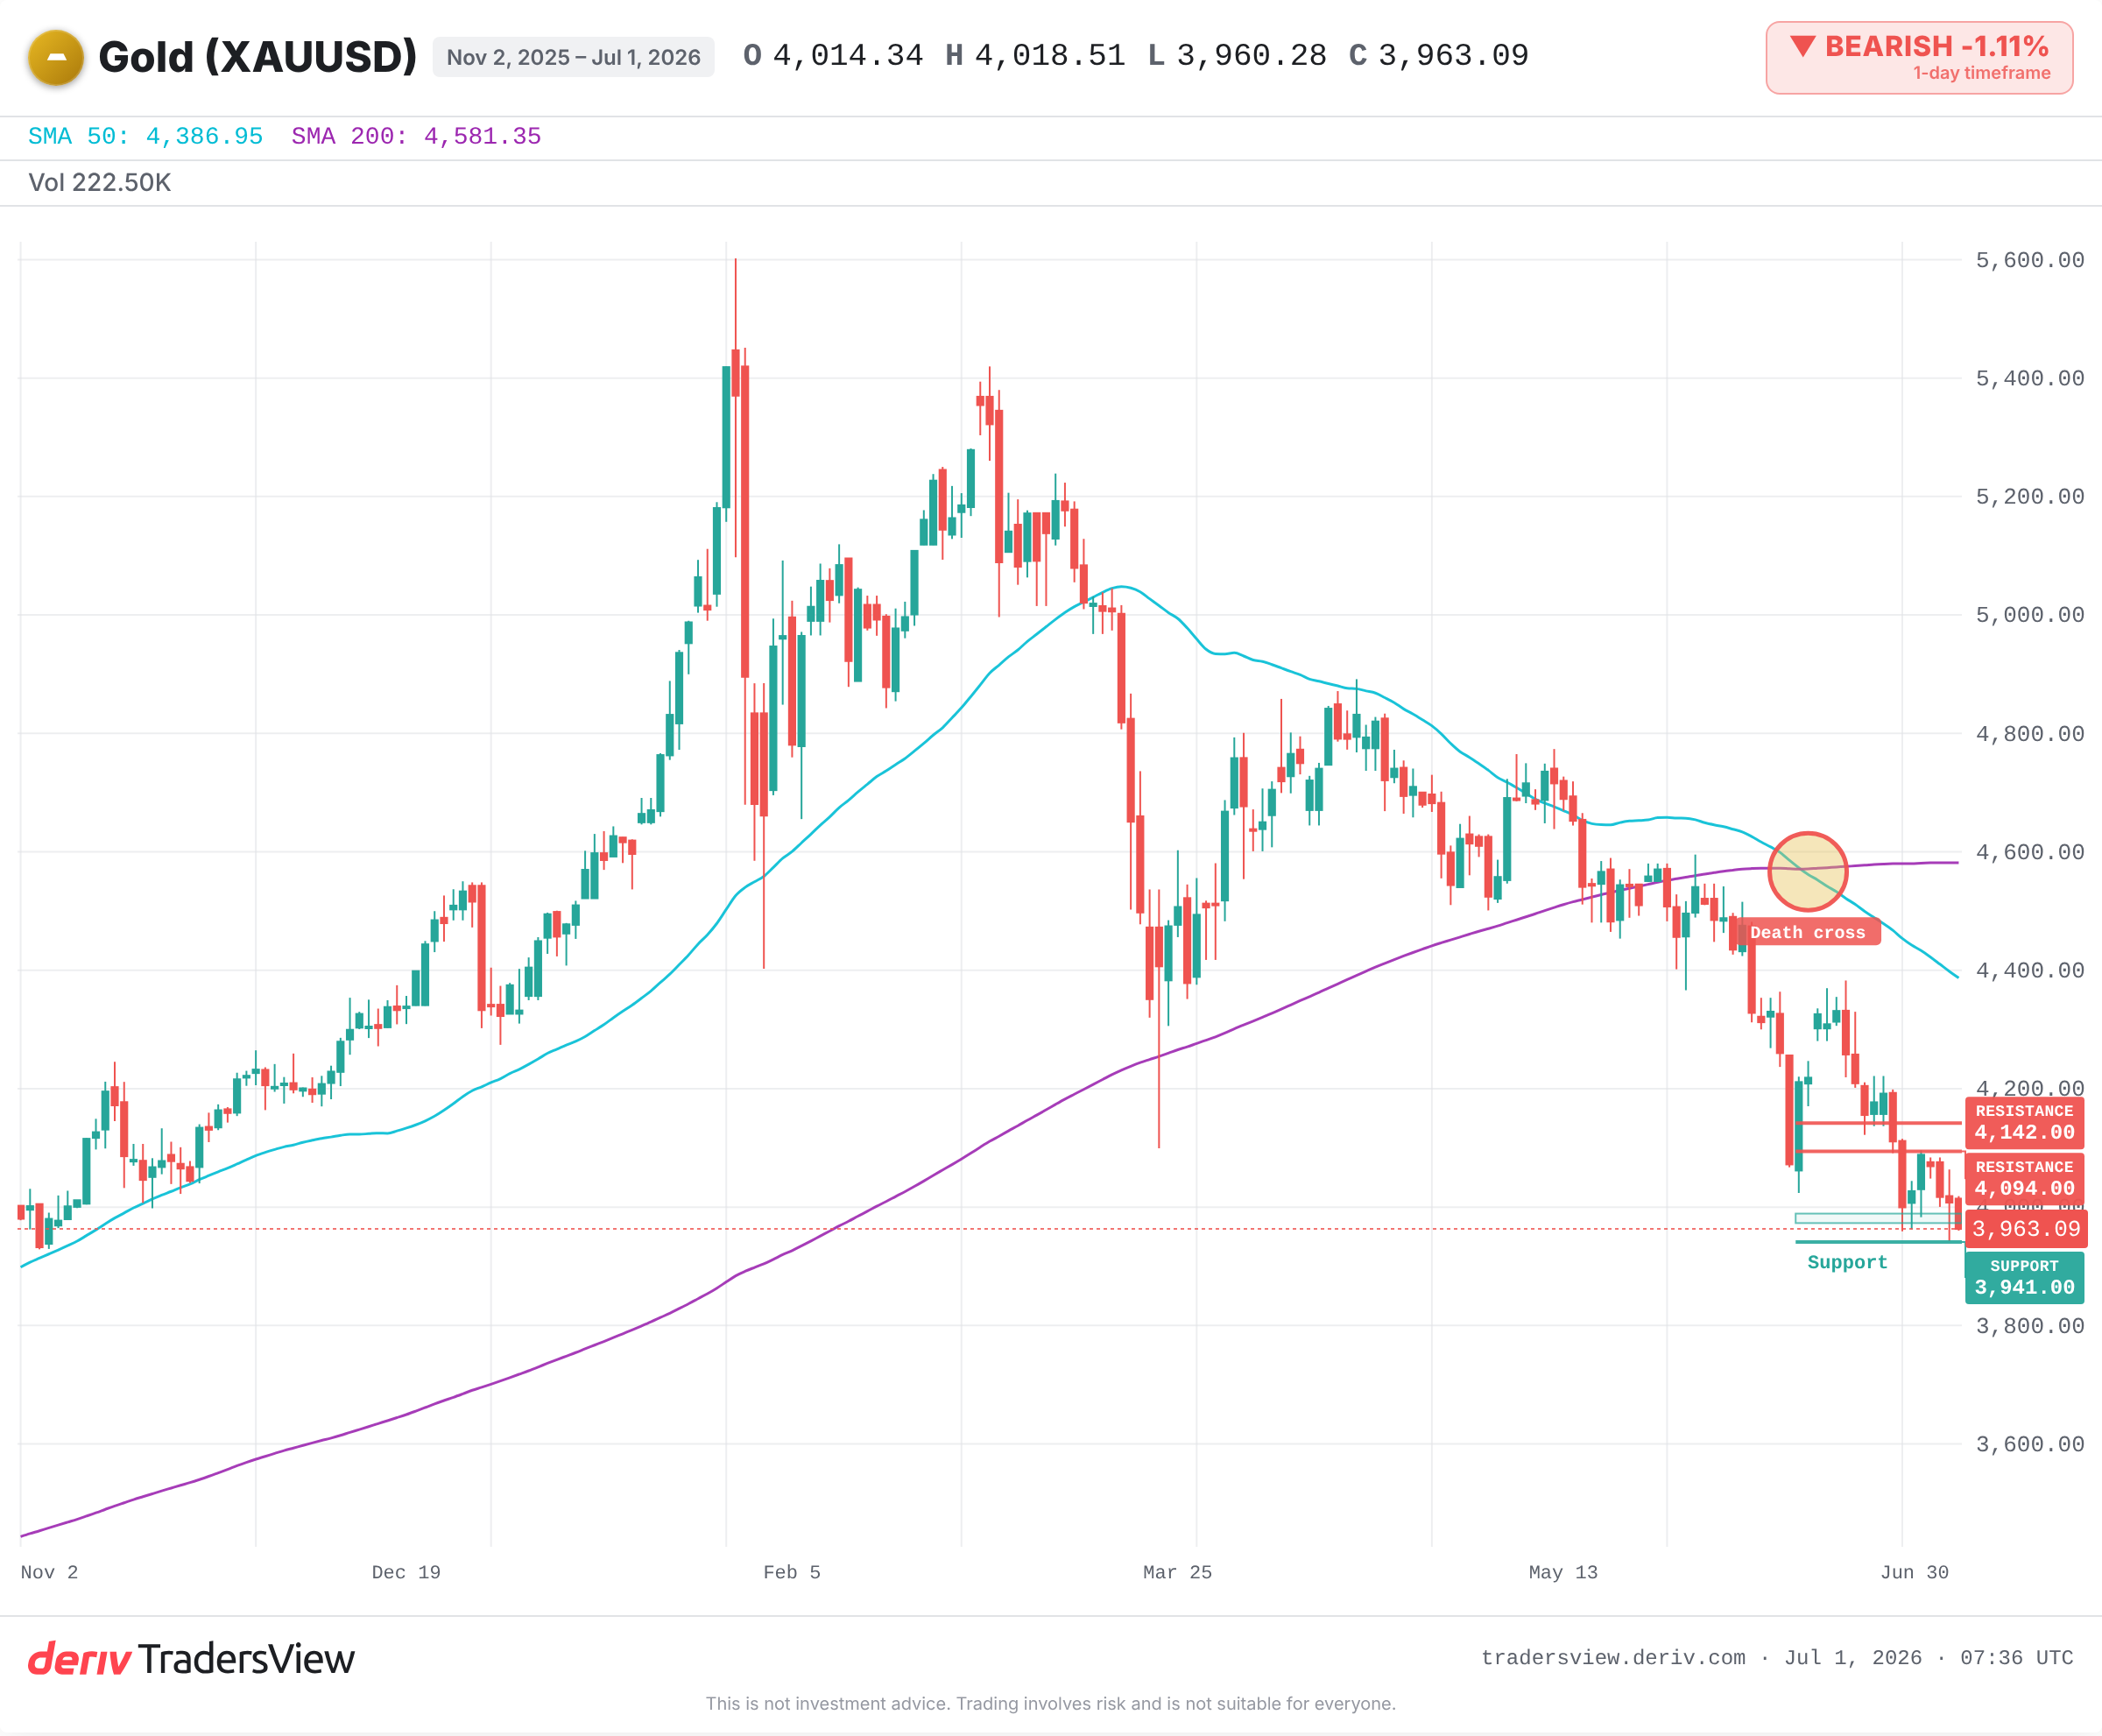
A support level that has held three times is not proof the low is in. It can be a countdown to a break. Gold is defending a triple bottom near $3,973 after a brutal slide from above $4,140. Whether it holds comes down to one question: which force controls this level, the macro trend pushing gold down, or the buyers who defend the floor.
Why a stronger dollar has dragged gold lower
Gold pays no interest. When the Federal Reserve turns hawkish and the dollar firms, holding dollar assets that pay a yield looks better by comparison. Capital rotates out of gold. That is the macro force, and it has been in control for weeks.
The evidence is one-sided. Gold has posted a double-digit monthly decline into quarter-end, its worst quarter since 2013. It hit an eight-month low near $3,941. Every rally has failed below the 50-day moving average around $4,094. A market that keeps failing at the same overhead level is a market still trending down.
The other buyer: who defends the floor
There are two very different buyers of gold. Speculators chase the dollar and interest rates, and right now they are sellers. Central banks buy the level, accumulating on weakness regardless of the rate story. They are why the $3,973 zone has held three times.
These two pull price in opposite directions. The tug-of-war at the floor is the whole game. Read the level right, and you understand the move.
Why a triple bottom can be a trap, not a green light
The comforting read is simple: support held three times, so the low is in. The problem is that each test consumes buyers. A floor tested repeatedly while a strong macro force presses on it tends to break, not bounce.
The technical picture leans bearish. A death cross has formed. The daily RSI sits below 45. Rallies keep dying under the 50-day line. When the trend, the moving averages and momentum all point one way, a defended floor is usually the last thing standing, not the turn.
What history says about a dominant macro force
2013 is the warning. As the Fed signalled it would taper its bond buying and real yields rose, gold broke multi-year support and ground lower for years, bottoming near $1,050 in late 2015. The macro force dominated for a long stretch, and support bounces along the way did not save it.
The flip side is 2016. Once rate-hike expectations eased and the dollar stalled, central-bank buying helped gold base and turn higher. The lesson is not that the floor holds or breaks. It is that the floor holds only once the macro force lets go.
What to watch next
The evidence leans bearish while the dollar and rate expectations stay firm. That view flips only on a clear change in the macro force. Watch these:
- A daily close below the $3,941 low would confirm the macro force is still winning.
- Reclaiming the 50-day moving average near $4,094 is the minimum the bull case needs.
- The dollar's direction and the next signals on interest rates.
- Central-bank purchase data, the buyer that could defend the floor.
- Silver holding its channel floor near $57 as a confirming or diverging signal.
The floor and the trend are fighting. Do not guess who wins. Watch the close below the low, or the reclaim above the 50-day line, and let price tell you which force took control.
Frequently asked questions
A triple bottom is a chart pattern where price falls to roughly the same support level three times and bounces each time. It suggests buyers are defending that level, but repeated tests can also exhaust those buyers and lead to a break.
Central banks buy gold to diversify their reserves away from currencies, and they tend to accumulate on weakness rather than chase price. Their buying is less sensitive to interest rates, so it can defend a level that speculators are selling.
A death cross is when a shorter moving average, often the 50-day, crosses below a longer one like the 200-day. It signals bearish momentum, but it is a lagging indicator and does not guarantee further falls on its own.
Gold is priced in dollars and pays no interest. When the dollar strengthens and yields on dollar assets rise, gold becomes relatively less attractive, which tends to push its price down.