What a $30,000 cut to Bitcoin's target really tells you
Citi cut its Bitcoin target by $30,000 by changing one input: ETF inflows. Here is why analyst targets are bets on drivers, not predictions.
By the Deriv desk · 1 July 2026 · 4 min read

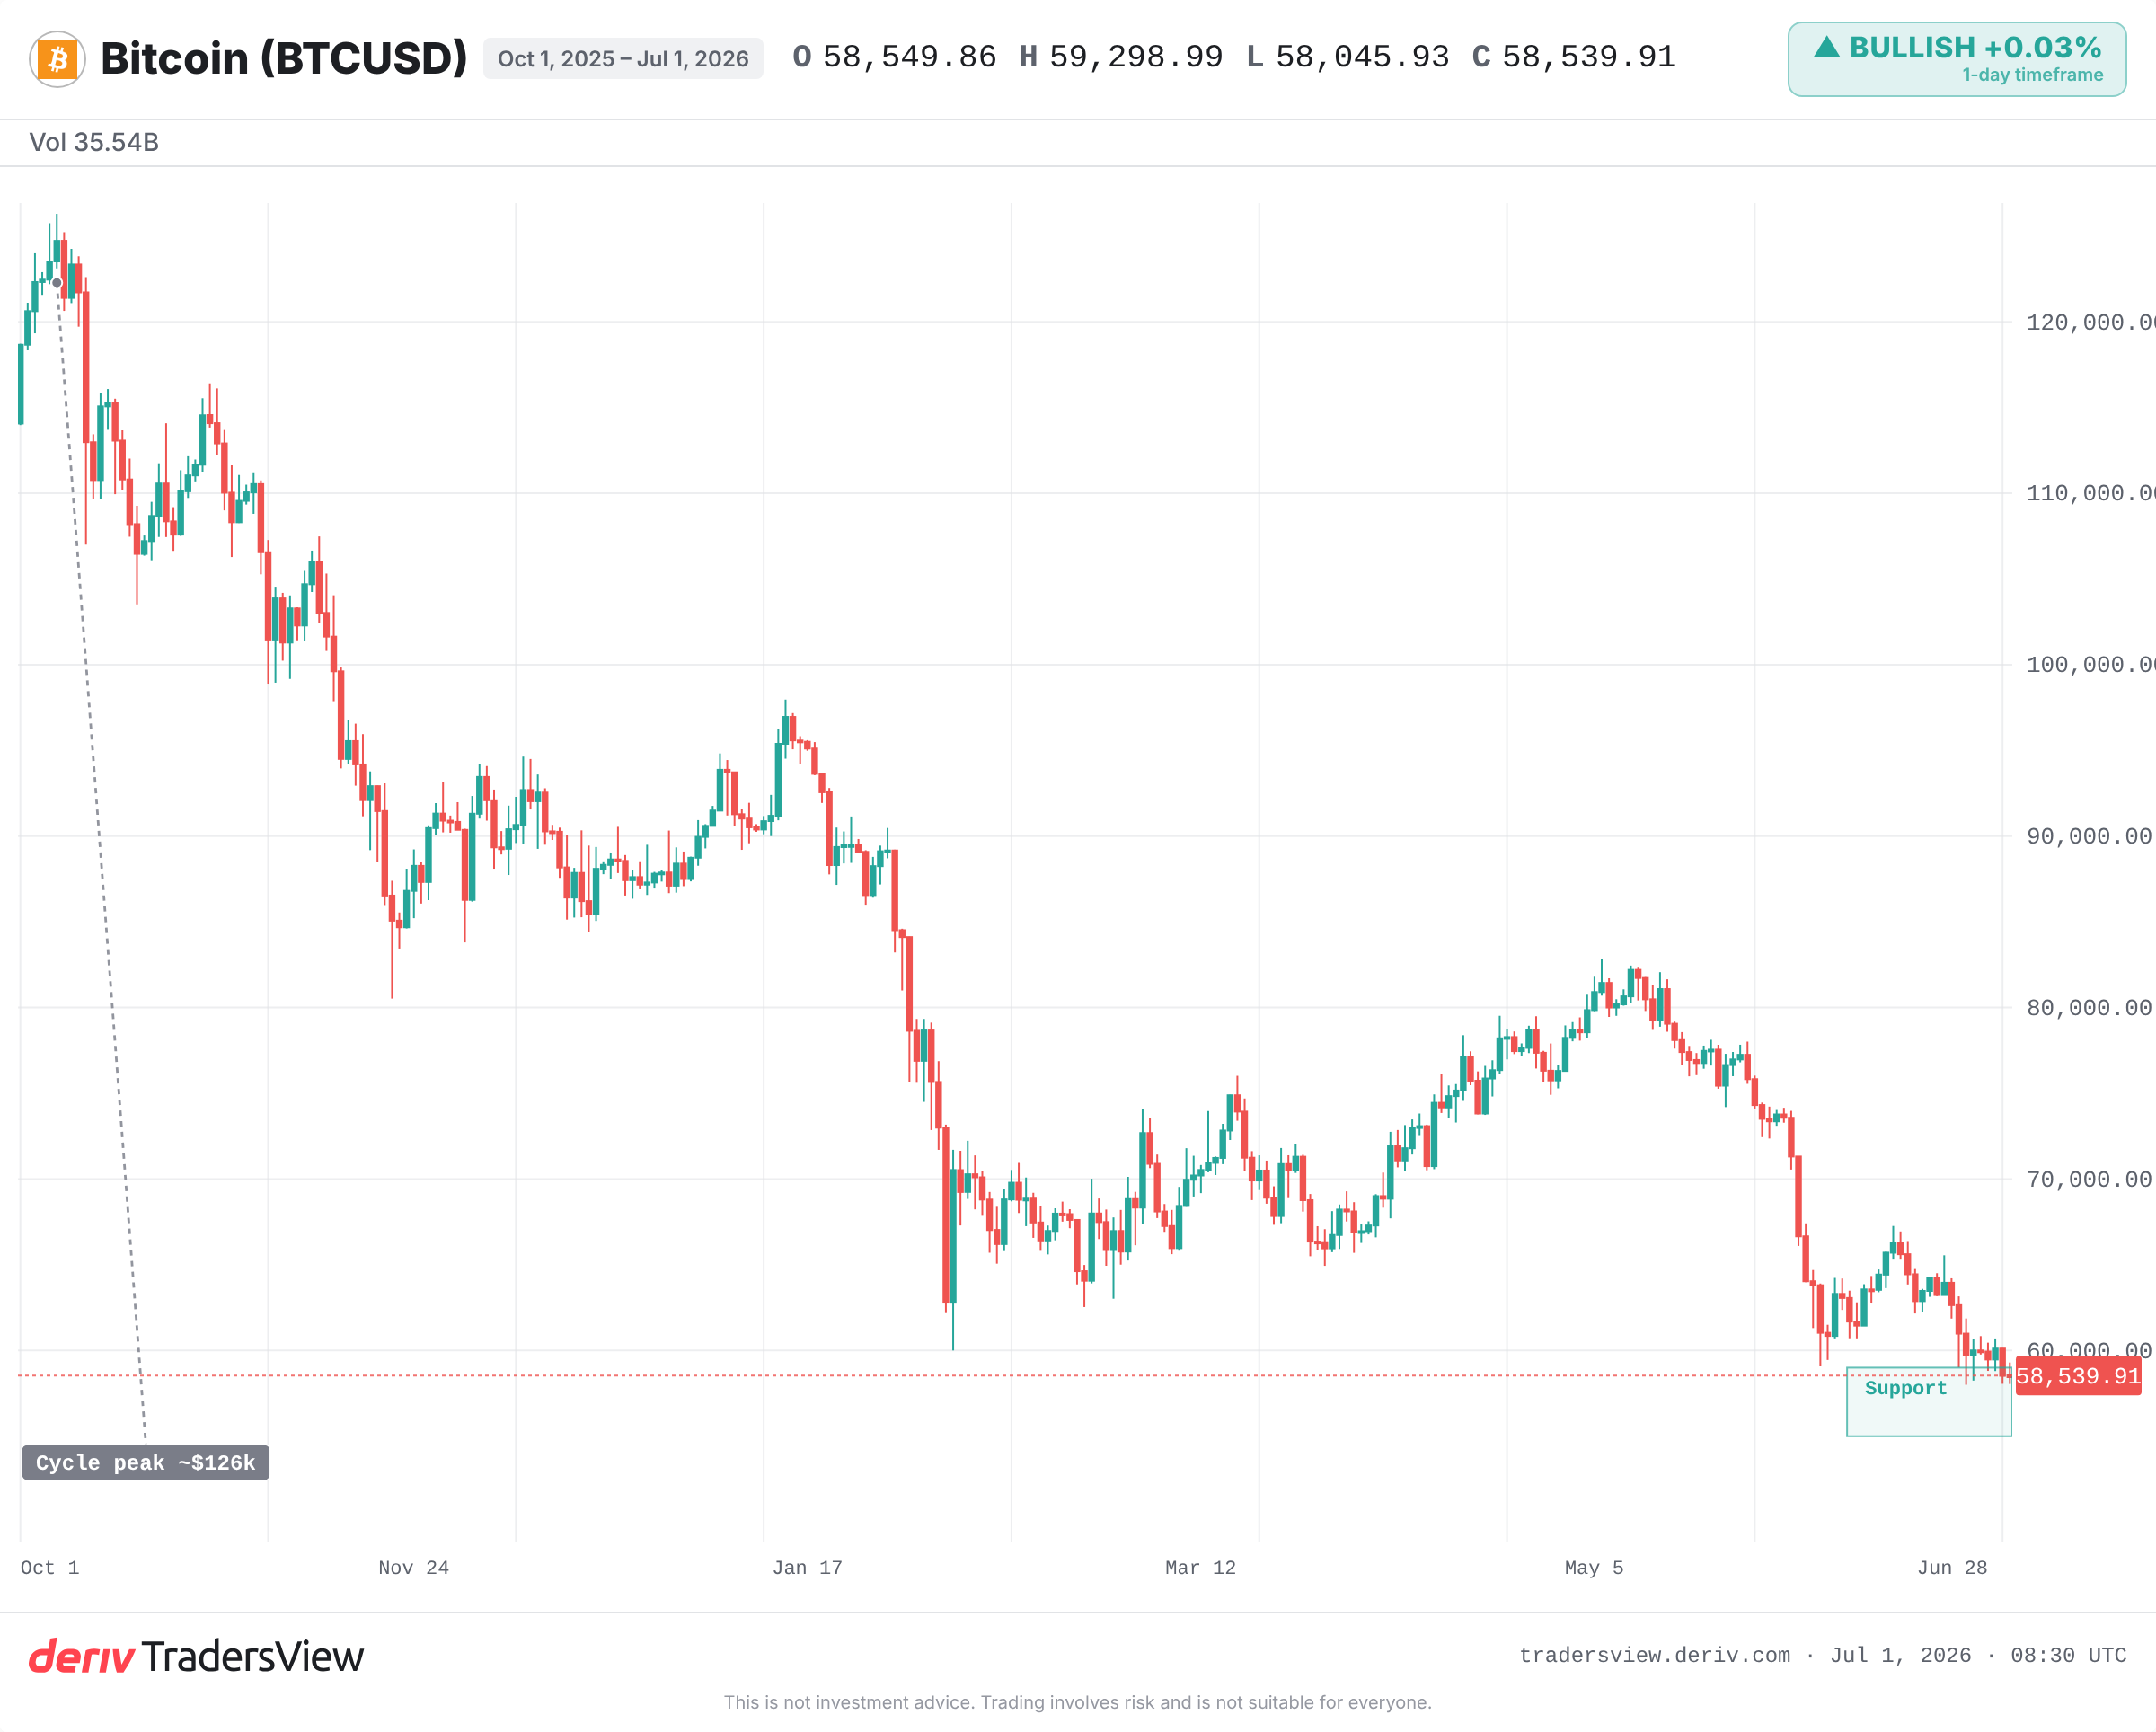
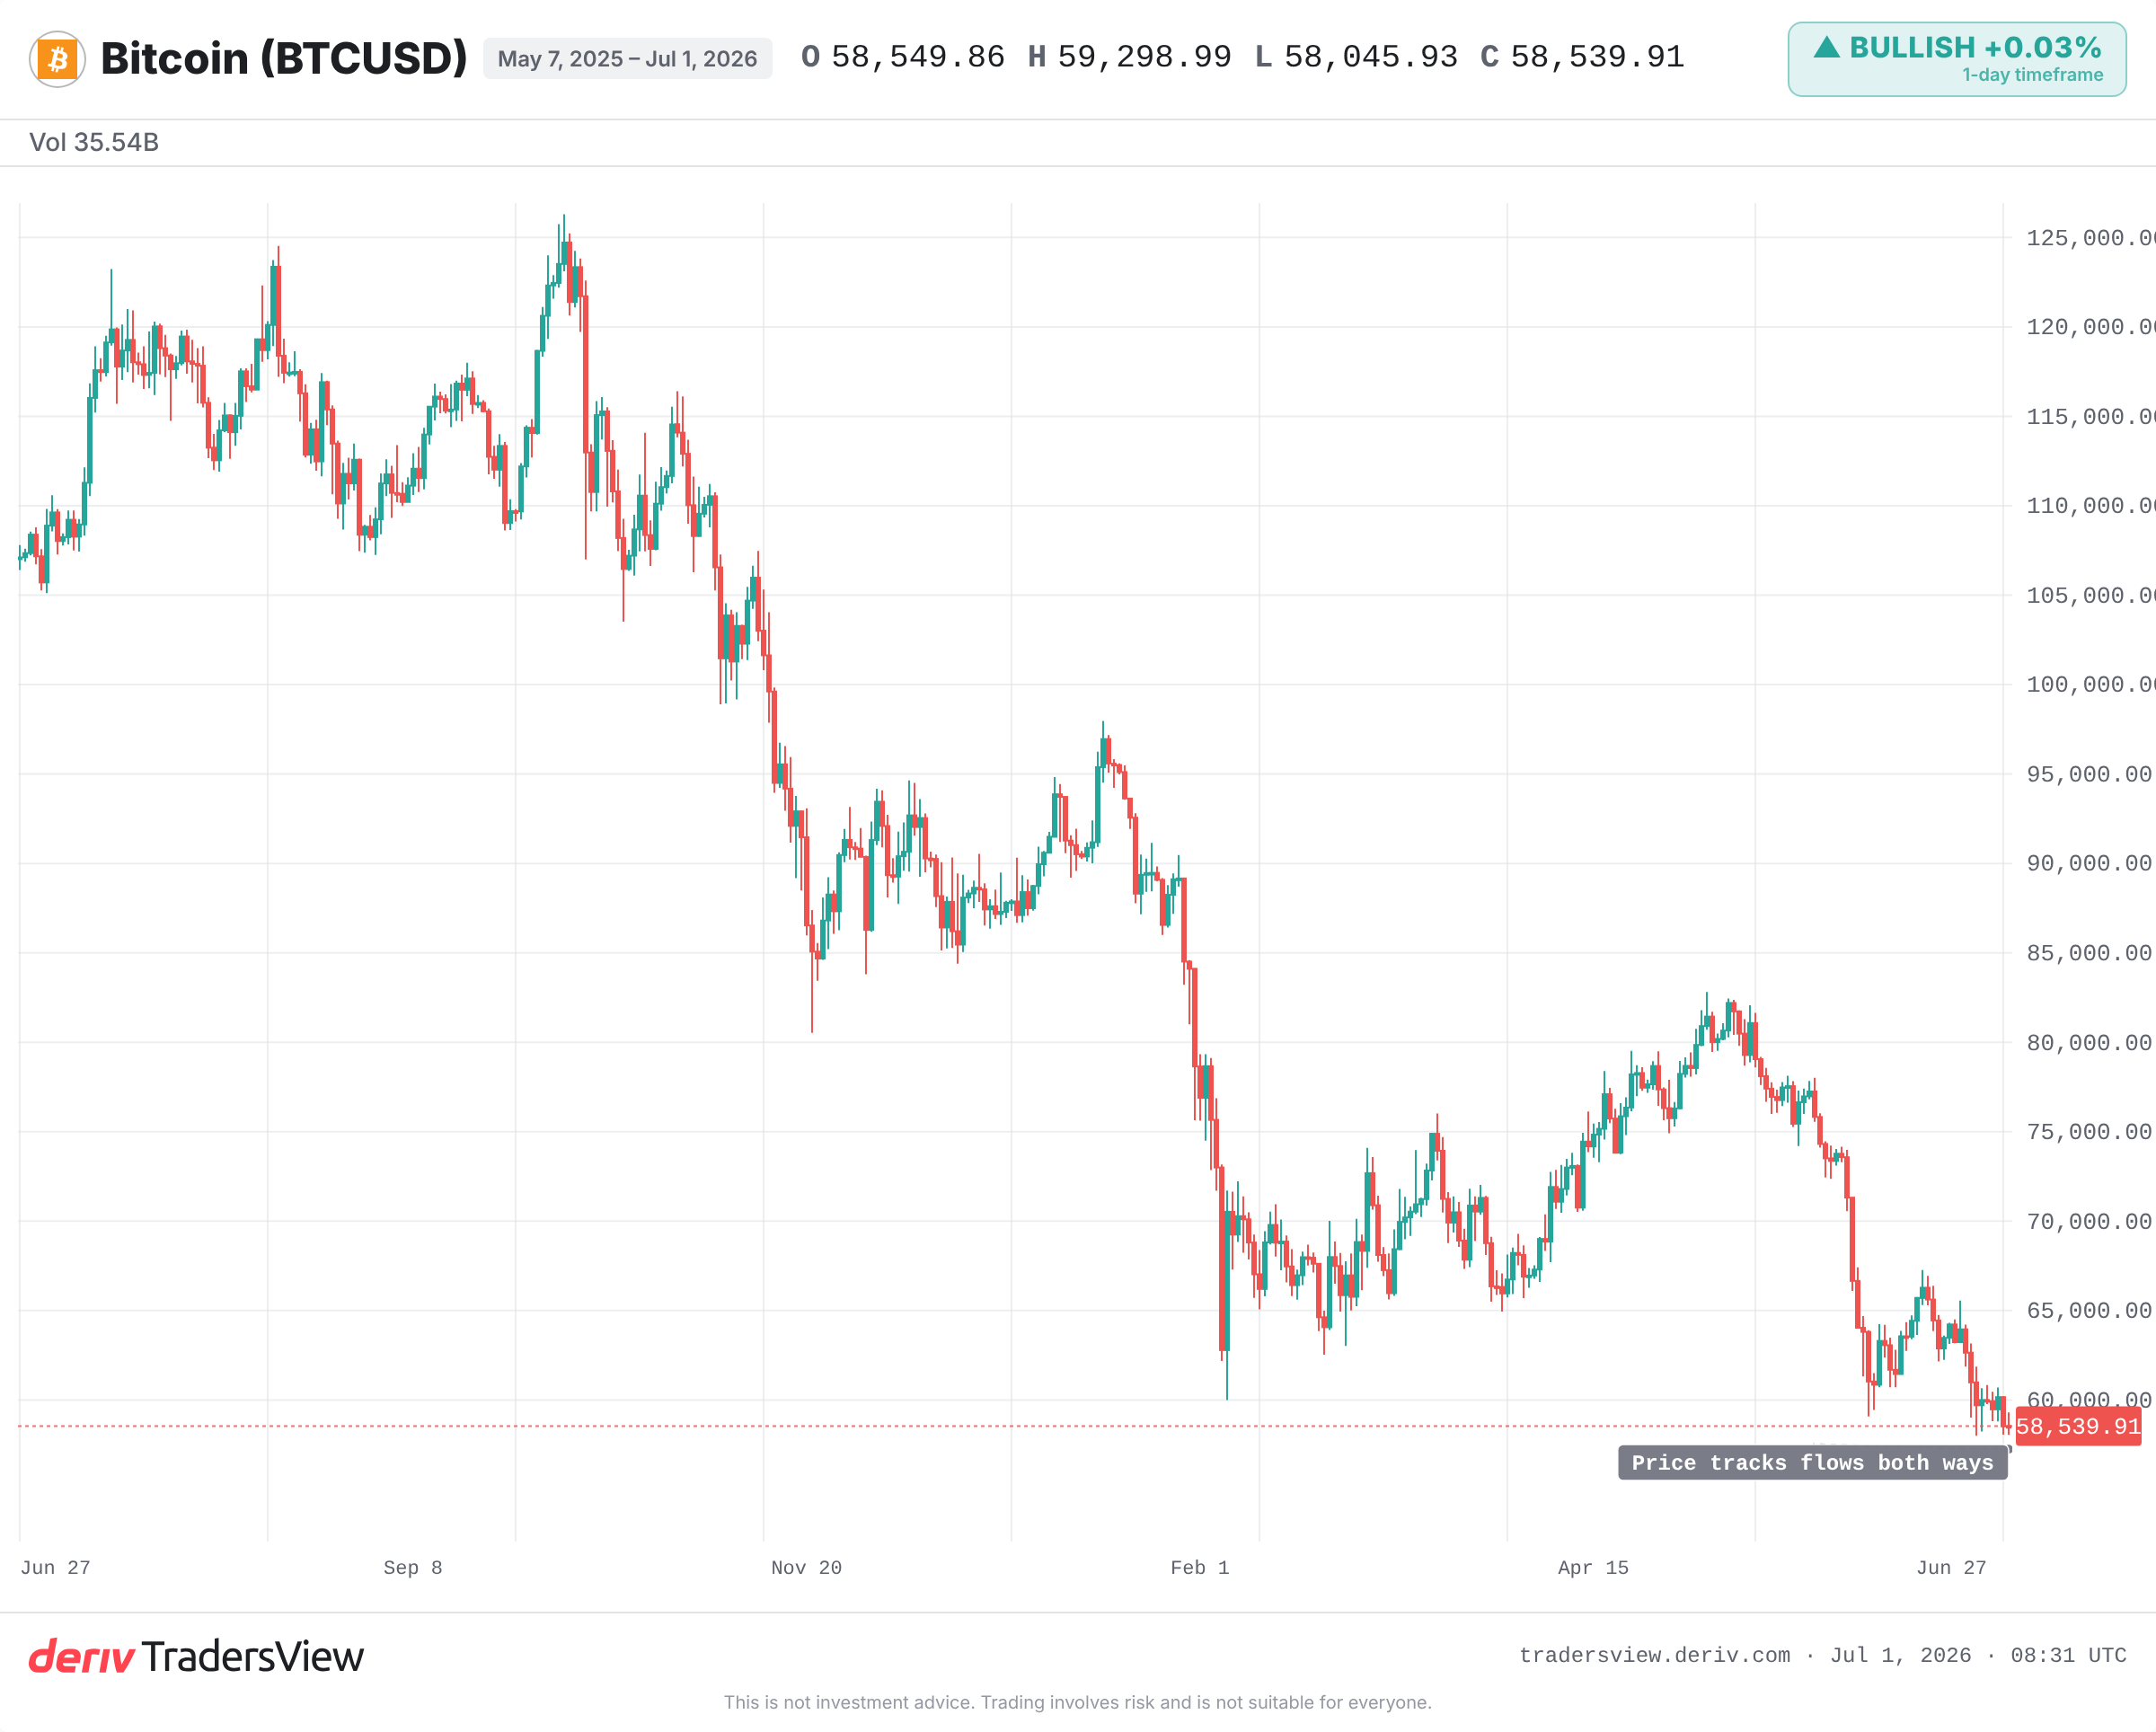
Citi's Bitcoin target fell by tens of thousands of dollars because one input changed: it now assumes zero net money flows into spot Bitcoin ETFs, down from $10 billion. The price did not do the damage. The assumption did.
A price target is a conditional bet, not a forecast. Change the driver underneath it and the whole number moves. That is the lesson worth keeping long after this week's headline fades.
Why Citi's Bitcoin target dropped so far, so fast
Citi lowered its 12-month Bitcoin target to $82,000 from $112,000. It did the same to Ethereum, cutting to $2,240 from $3,175. The reason was mechanical, not emotional.
Citi had assumed roughly $10 billion of net inflows into spot Bitcoin ETFs. It reset that assumption to zero. When the buyer you built the model around disappears, every number resting on that buyer gets marked down at once.
Spot ETFs became the dominant marginal buyer of Bitcoin after they launched in early 2024. When their flows turn negative, the demand that justified higher targets is simply gone.
Analyst price targets are bets on one hidden assumption
Look at the spread of forecasts for the same coin. Citi sits near $82,000. Standard Chartered holds a $100,000 year-end target. 10x Research warns of a slide toward $55,000.
These are not three views of the future. They are three different assumptions about fund flows and liquidity. The wide gap tells you how uncertain the driver is, not how clever any single analyst is.
Standard Chartered argues the cycle low is already in near the $59,000 zone. 10x Research thinks thin summer liquidity could drag prices lower. Same asset, opposite conclusions, because they disagree on one input.
What happens when the flow that drove an asset reverses
History shows how much a broken driver matters. In the 2022 bear market, spot ETFs did not exist. The prior bull ran on leverage and retail buying, and when Terra and FTX collapsed, that flow vanished. Bitcoin fell from around $69,000 to roughly $16,000.
The mirror image came in early 2024. ETFs launched, pulled in record inflows, and Bitcoin ran to a new high above $73,000. The price tracked the flow closely in both directions.
Not every broken driver is permanent. In mid-2021, China's mining ban halved Bitcoin within weeks, then it recovered later that year. A reversed flow can be temporary, which is exactly why zero-inflow is an assumption, not a fact.
The bear case rests on a guess that can flip
Citi's cut assumes zero or negative ETF flows persist. That is itself a call that can change. If outflows stall and reverse, the same models that cut to $82,000 revise back up just as quickly.
As of now, Bitcoin trades near $58,500, already testing the zone bears call a bottom. The setup cuts both ways. The evidence leans toward flows, not price predictions, being the thing to watch.
Bitcoin is volatile, and no level is guaranteed to hold. What to track:
- Weekly US spot Bitcoin ETF net flows: sustained outflows confirm the bear case, a flip to inflows breaks it.
- Whether Bitcoin holds the roughly $55,000 to $59,000 zone.
- The Fed rate path in 2026, which Bank of America expects to tighten.
- Ethereum, where Citi also cut its target, as a confirmation or divergence signal.
When you next read a headline target, ask what assumption sits underneath it. That single input is the whole story.
Frequently asked questions
Spot Bitcoin ETFs buy actual Bitcoin to back their shares. When money flows in, the fund buys, adding demand. When investors sell out, the fund sells, adding supply. Since 2024 these funds have been a major marginal buyer, so their net flows heavily influence price.
No. It is a 12-month conditional estimate based on specific assumptions, mainly about fund flows. If those assumptions change, the target changes. It signals what an analyst expects under one set of conditions, not a guaranteed outcome.
Because they use different assumptions about drivers like ETF flows, liquidity and interest rates. A wide spread between targets reflects genuine uncertainty about those inputs, not that one analyst is simply right and the others wrong.
A sustained reversal in ETF flows from outflows back to inflows would be the clearest trigger. Because targets are built on flow assumptions, a flip in the data can prompt upward revisions as quickly as the cuts came.